

Comparison and bias
Method comparison
Before reporting patient results on a new method, run the same patient specimens on it and your comparative method. LabRuns checks each pair against your allowable difference. Passing–Bablok or Deming regression estimates constant and proportional bias, with predicted bias at your medical decision levels.
Your first week is free, with no card needed. See pricing.
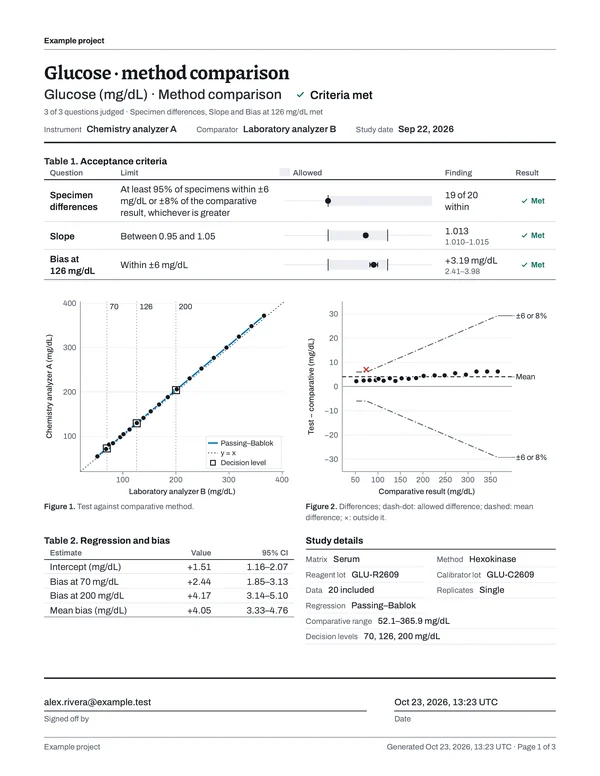
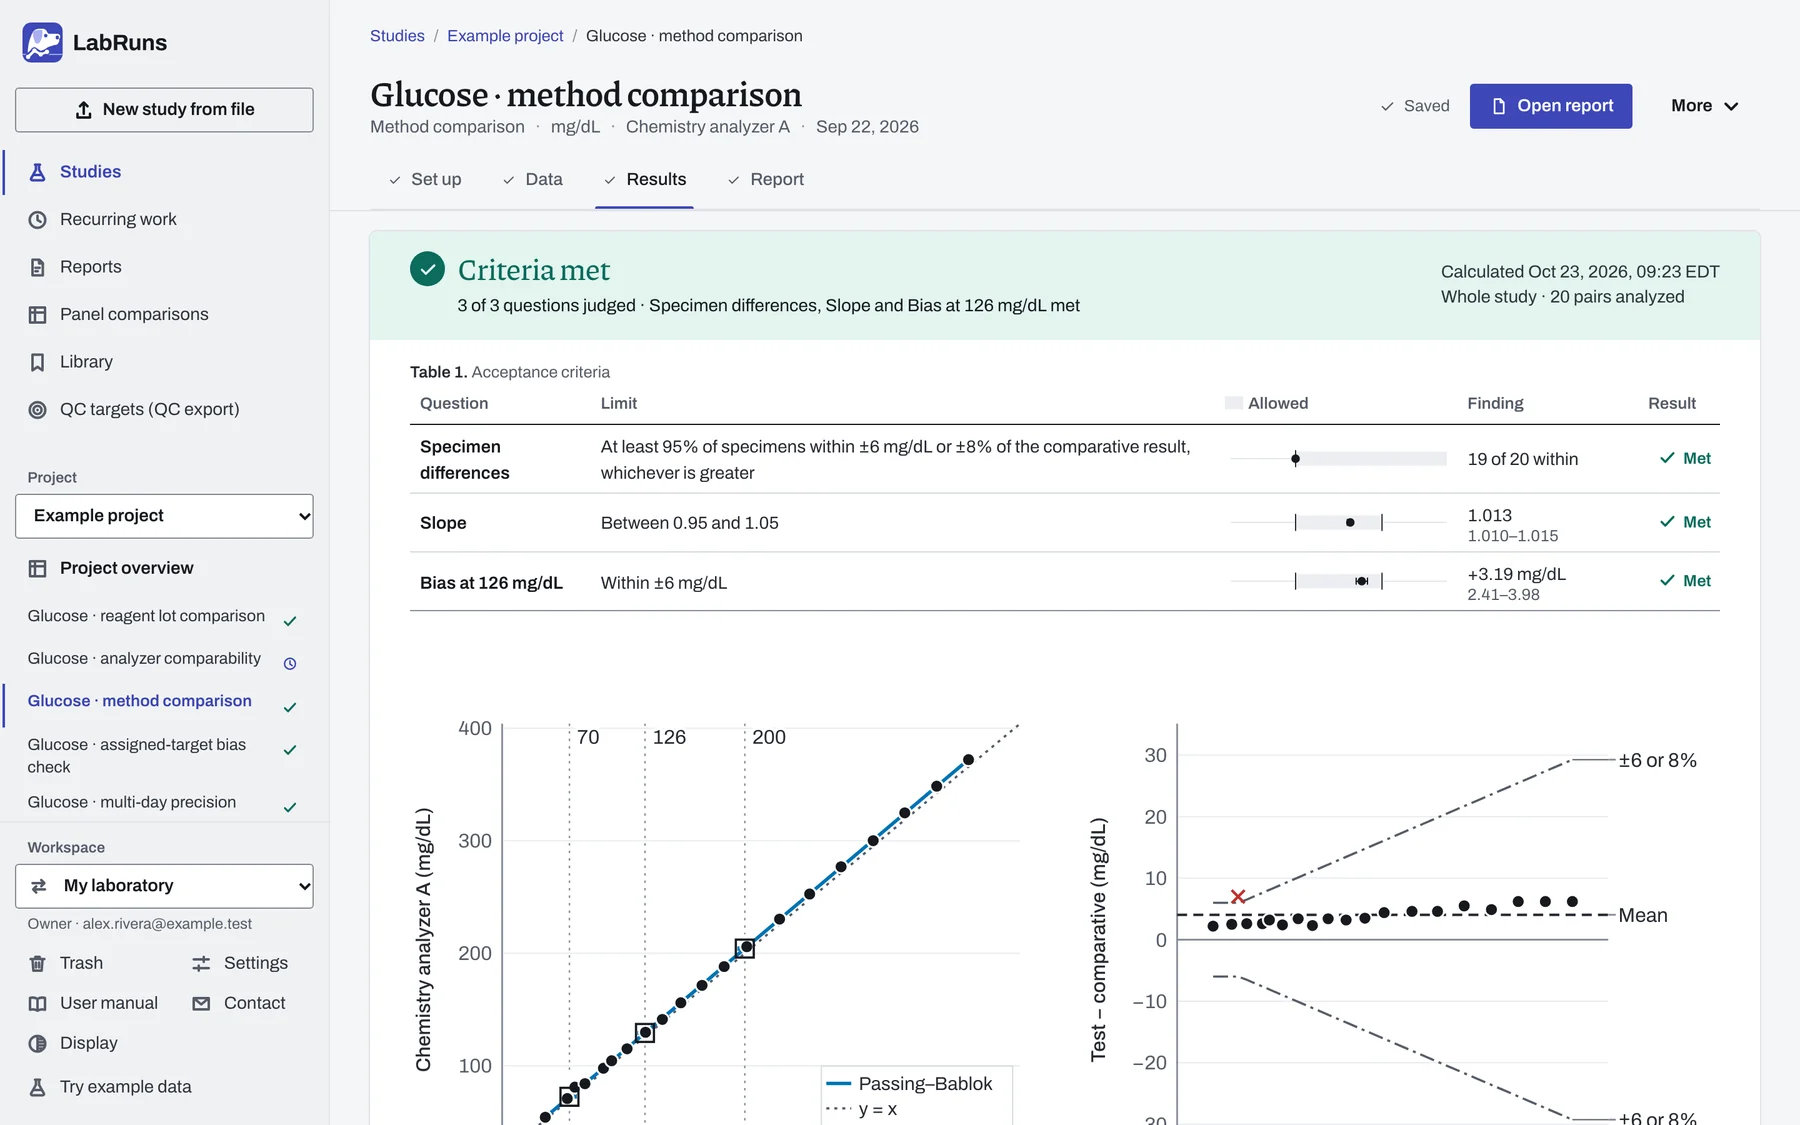
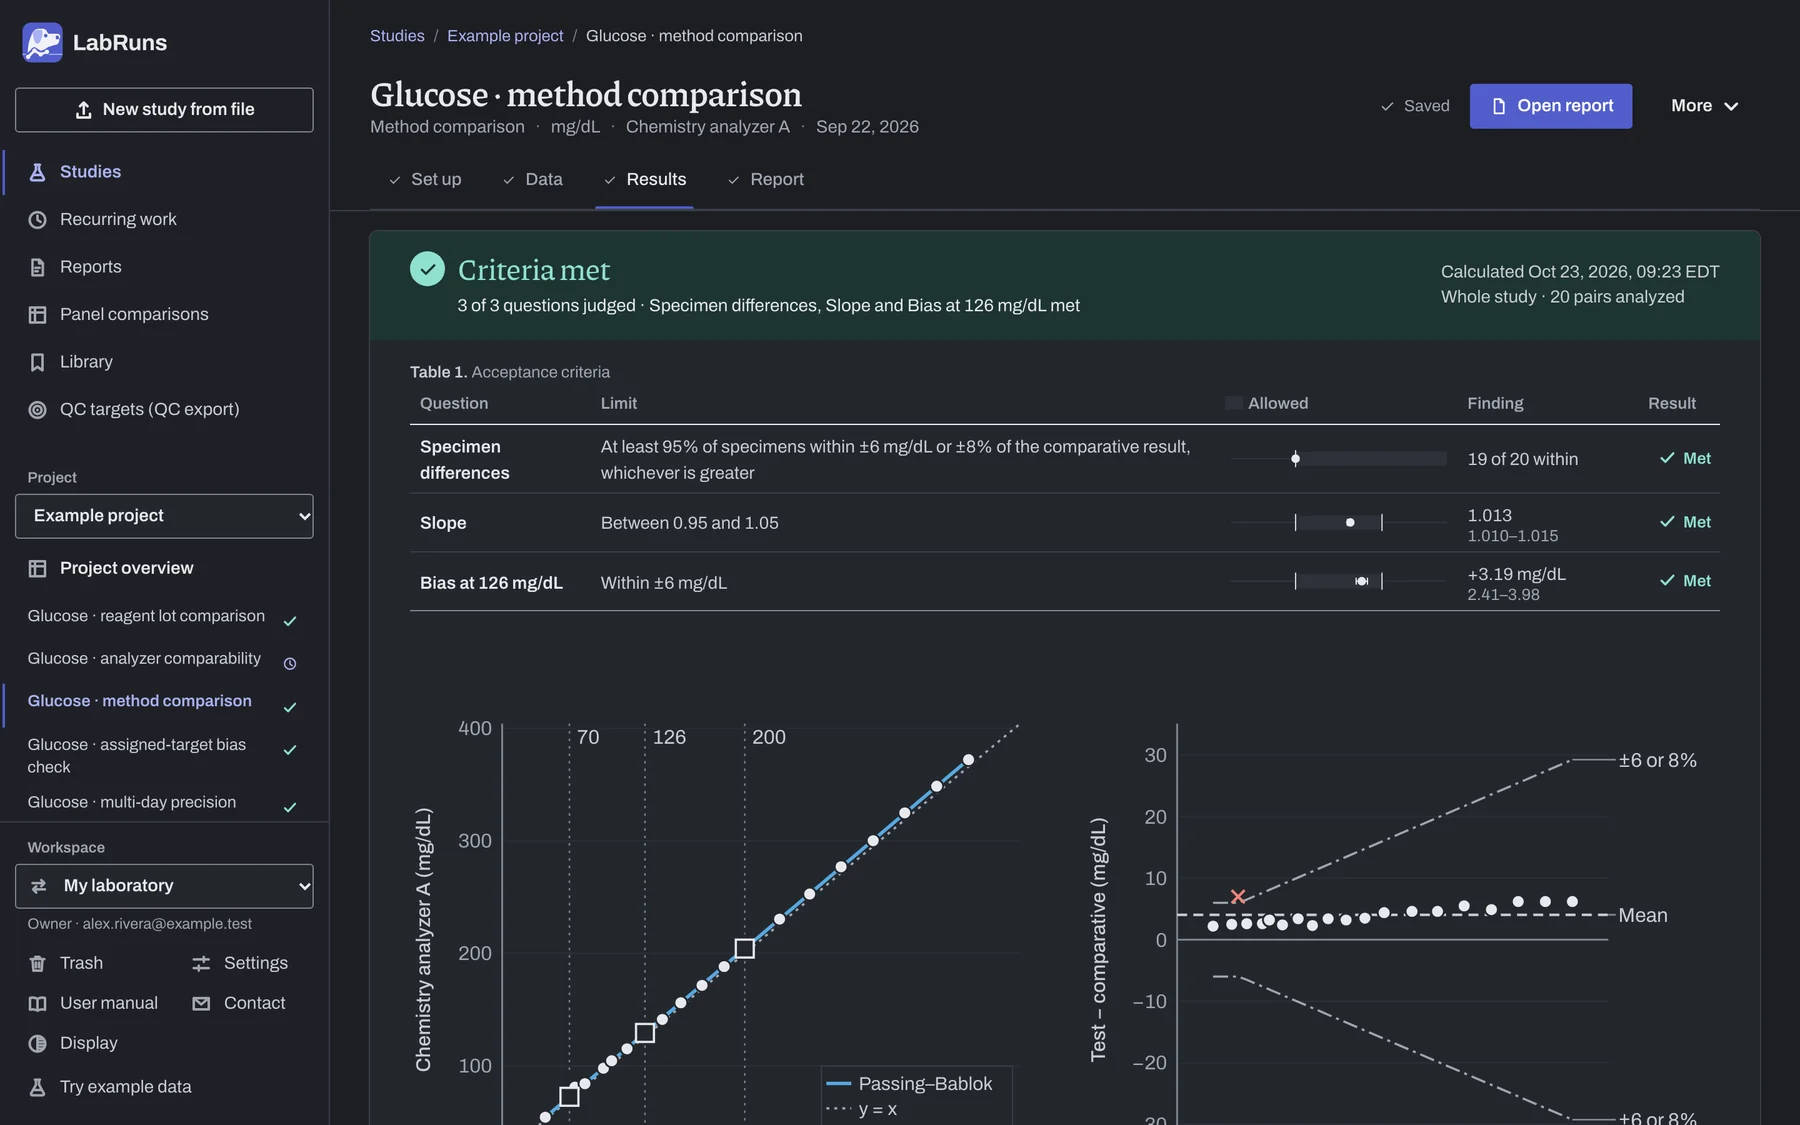
Every limit and its result on one screen.
Each specimen's difference, the slope and the bias at your decision levels are judged against the limits you typed, with Met or Not met beside each one and the Passing–Bablok and difference plots underneath.
Collection plan
- Independent patient specimens spanning low, middle and high results, including the medical decision levels.
- A coded ID for each specimen.
- Both methods calibrated with acceptable QC. Measure within the specimens' documented stability limits.
Suggested starting design: 40 specimens × 1 measurement on each method; 80 results in 40 paired rows.
For replicate-derived Deming λ: 40 specimens × 2 measurements on each method; 160 results in 80 paired rows.
Tighter bias estimates or wider concentration coverage may need more specimens. For a 40-specimen design, see this published CRP comparison.
Acceptance limits
Set the allowable difference for each specimen as an amount in the study unit, a percentage of the comparative result, or whichever of the two is greater. Pick one of the sourced proficiency-testing limits for the analyte where there is one, or type your own, and add a bias limit at each medical decision level.
The specimen rule is met when at least 95% of specimens fall within their allowable difference. With fewer than 20 specimens, that means every one of them.
Report
Page 1 puts the regression plot next to each specimen's difference, drawn against its allowable difference. One table gives the slope, the intercept, the mean bias and the bias at each medical decision level, each with its confidence interval, your limit and the result. Later pages show every specimen's outcome, the difference plot with its 95% limits of agreement and the full data listing.
Records
Each saved calculation keeps the data and limits it used. History lists every saved calculation and signed report, each with its own PDF. Prepare an evidence binder with the report versions you choose, grouped by analyte or analyzer, and download the combined PDF and supporting archive.
Guides
Read the bench guide before you collect, or follow an example study from setup to its signed report.
Run your next method comparison.
Start from the suggested collection plan, bring in your analyzer results and sign the report once your laboratory has made its decision.