


Bias against an assigned value reference
For each level, the study compares the mean of the included results with the assigned value. It reports bias (mean minus assigned value, in the study unit), relative bias (bias as a percentage of the assigned value) and recovery (mean as a percentage of the assigned value). The assigned value's uncertainty appears beside the result.
Settings
Section titled “Settings”Bias check sits under Comparison and bias in the New study dialog, which also asks for the Assigned value. That value is for level 1; when an imported file of one material names its level after the material, the value moves to that level.
The Assigned values table on Set up holds one row per level. Each level in the data gets its own row automatically, and each level is analysed separately.
| Field | Required? | What to enter |
|---|---|---|
| Level | Yes | The level name used in the data, for example 1 |
| Assigned value | Yes | A number in the study unit |
| Standard uncertainty | No | Standard uncertainty (k = 1) in the study unit |
Columns
Section titled “Columns”| Column use | Grid column | Required? | What to enter |
|---|---|---|---|
| Specimen or material ID | Specimen / material ID | Once per level | For example CRM-1. Saving fills it in on the level's other rows; with none, the level is named Level 1 |
| Result | Result | Yes | Each measured value, in the study unit |
| Level or group | Level | No | For more than one material. Must match a level in Assigned values. Default: the material ID for an imported file without a Level column, 1 for a row added by hand |
| Day | Day | Recommended | The collection day, for example 1 to 5. Left blank if the file has no Day column |
| Run | Run | Recommended | The run within that day, for example 1. Left blank if the file has no Run column |
| Replicate | Replicate | No | Replicate label |
The material ID, Day and Run decide which intervals a level gets; see Intervals by how results relate. The optional Excluded and Exclusion reason columns are in Fields every study type offers.
The calculation stops while a level with results has no assigned value. See Calculate results.
Acceptance limits
Section titled “Acceptance limits”- A Bias limit compares each level's mean minus its assigned value. A percentage is taken of that level's own assigned value.
- On an interval scale, Pass only when within both cannot meet because its percentage cannot be calculated. It reads Not met if the bias exceeds the study-unit limit, and Undecided otherwise.
- Limits on Relative bias and Recovery are in
%. An SD limit under More statistics can also require both study-unit and percentage allowances; on an interval scale it is Not met when its study-unit requirement fails and Undecided otherwise. - A value that can't be calculated, or a level with 1 included result, gives Undecided.
- After an assigned value is corrected, a Mean or Median limit built on the old value is Undecided.
- Available means, bias, relative bias and recovery decide their limits whether or not the level has an interval; the interval does not change that comparison.
A limit that is Not met makes the whole study Criteria not met. See Acceptance limits and About acceptance decisions.
Results and plots
Section titled “Results and plots”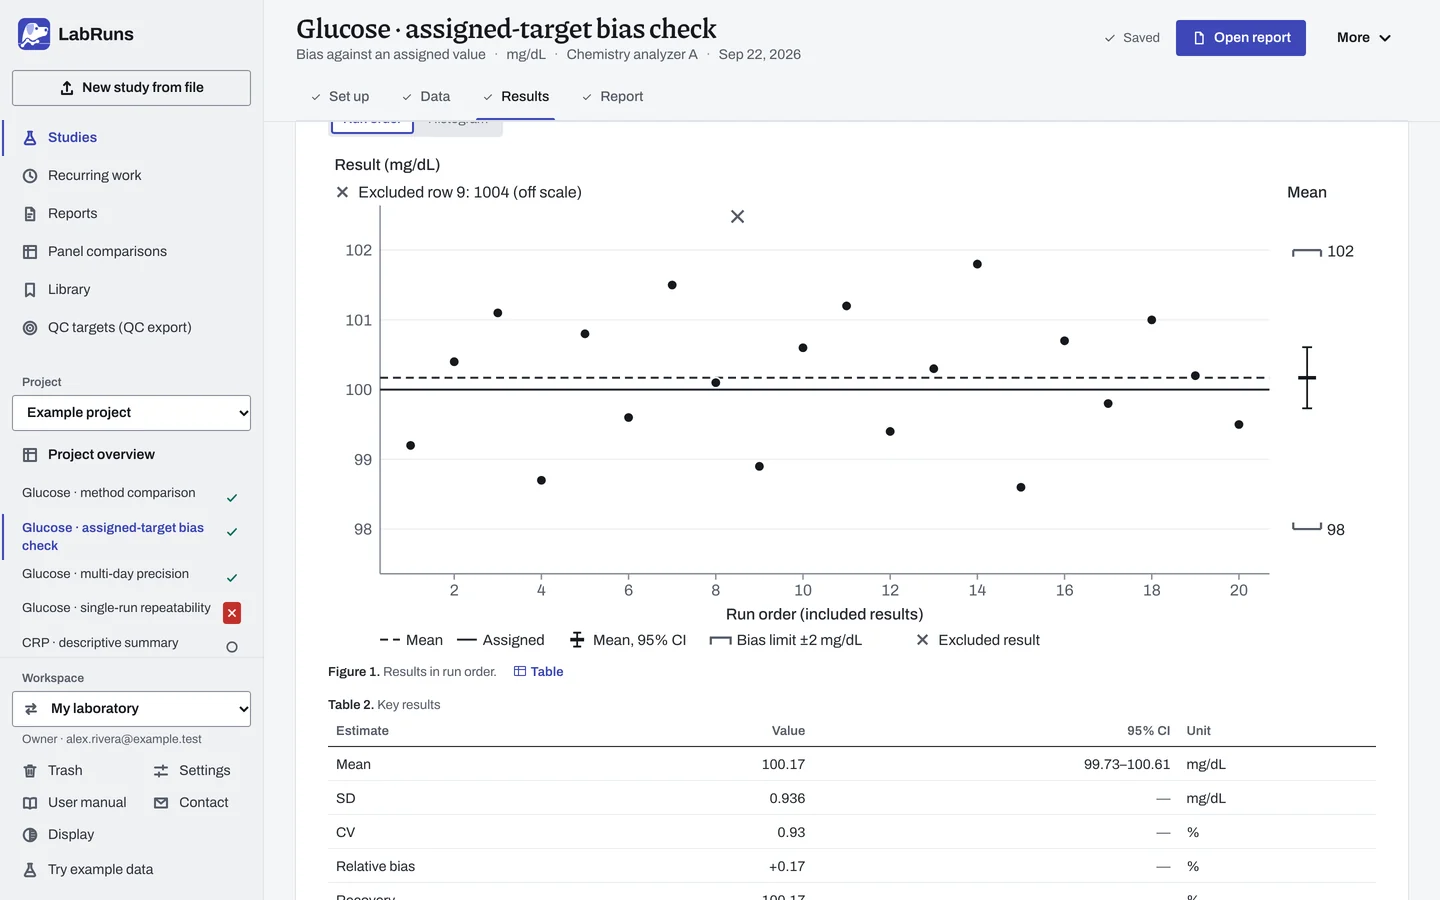
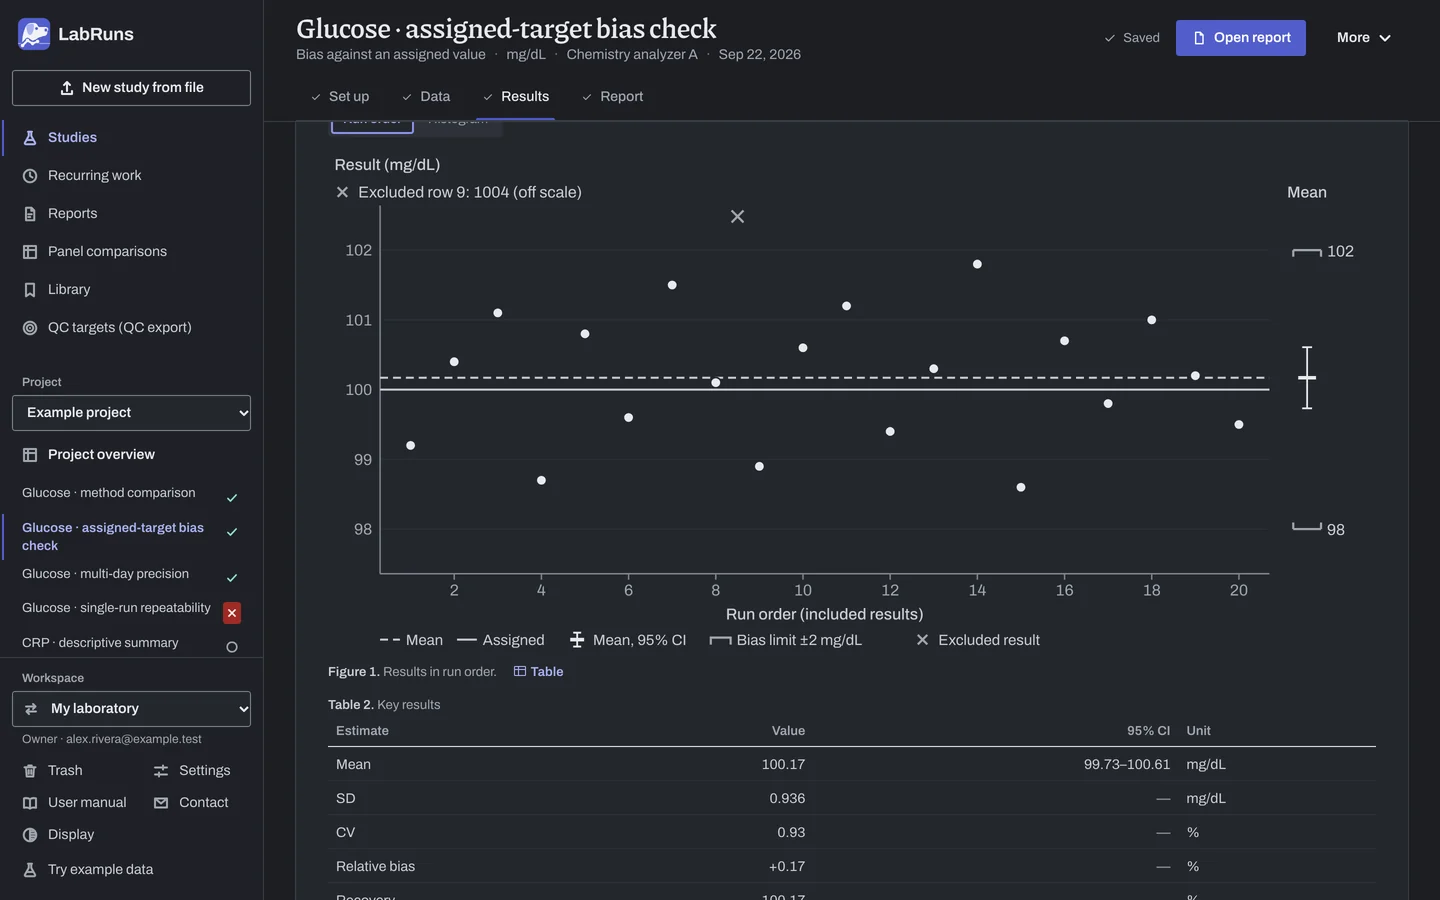
- The acceptance table below the verdict shows each limit with its observed value and outcome. Key results gives the mean, SD, CV, bias with its confidence interval, relative bias and recovery; the assigned value is under study details.
- Additional estimates adds the median, range, Assigned-value standard uncertainty, Combined standard uncertainty and Bias 95% interval with assigned-value uncertainty.
- Bias keeps its sign: positive means the method reads high. +0.10% relative bias is the same as 100.10% recovery.
- The bias 95% CI in Key results covers replicate scatter. Bias 95% interval with assigned-value uncertainty adds the assigned value's uncertainty and is wider.
Example
Section titled “Example”accuracy.csv holds ten results for one reference material, all with material ID CRM-1, Day 1 and Run 1, and no level column. Because they are one run, the intervals below describe that run's repeatability. The same material measured over 5 days, as in the suggested plan, gives the bias without intervals.
Setup: analyte Glucose, unit mg/dL, 95% confidence. Assigned value: 100.0 mg/dL (it moves to level CRM-1, named after the material), standard uncertainty 0.15 mg/dL. Limits: Bias (-1 to 1 mg/dL) and Recovery (98 to 102 %).
| Estimate | Displayed value |
|---|---|
| Included results | 10 |
| Mean | 100.10 mg/dL |
| Sample SD / CV | 0.258 mg/dL / 0.26% |
| Assigned value | 100 mg/dL |
| Assigned-value standard uncertainty | 0.15 mg/dL |
| Bias (mean minus target) | +0.10 mg/dL |
| Relative bias | +0.10% |
| Recovery | 100.10% |
| Bias 95% CI | −0.08 to 0.28 mg/dL |
| Combined standard uncertainty | 0.171 mg/dL |
| Bias 95% interval with assigned-value uncertainty | −0.29 to 0.49 mg/dL |
| Criterion | Observed | Acceptance limit | Outcome |
|---|---|---|---|
| Bias | +0.10 mg/dL | ±1 mg/dL | Met |
| Recovery | 100.10% | 98–102% | Met |
The study status is Criteria met.
The example project's study Glucose · assigned-target bias check uses the 20 replicates of repeatability.csv against 100 mg/dL: mean 100.17 mg/dL, bias +0.17 mg/dL, relative bias +0.17%, recovery 100.17%. Its Bias limit, ±2 mg/dL, is met.
Calculations and sources
Section titled “Calculations and sources”When you calculate Glucose · assigned-target bias check in the example project, LabRuns records these methods:
- Arithmetic mean, and sample SD with an n − 1 denominator.
- Quantiles use linear interpolation (Hyndman–Fan type 7). The histogram has ⌈√n⌉ equal-width bins, at most 40.
- Two-sided 95% Student t CI for the mean.
- Results are grouped by concentration level. Every included result is used.
- Criteria evaluate the unrounded estimates.
- SD allowances using a percentage require a ratio scale. With both limits required on an interval scale, a failed study-unit requirement fails the criterion; otherwise it is undecided.
- Bias is the level mean minus the assigned value. Percent bias and recovery divide by the assigned value.
- A stated assigned-value standard uncertainty is treated as independent of the measurement mean: u_c = √(SD²/n + u_target²). The combined interval is bias ± t[(1 + confidence)/2, n − 1] × u_c, using the measurement degrees of freedom as an application coverage convention. Assigned-value degrees of freedom are not separately estimated.
For each level:
| Estimate | How it is calculated |
|---|---|
| Relative bias | 100 × bias / |assigned value|, in % |
| Recovery | 100 × mean / assigned value, in % |
| CV | 100 × SD / mean |
| Target standard uncertainty | The stated u, in the study unit |
| Measurement bias CI | Mean CI − target, with mean CI = mean ± t(1 − α/2, n − 1) × SD / √n |
| Combined standard uncertainty | u_c = √(SD²/n + u_target²), for independent observations only |
| Bias CI including target uncertainty | Bias ± t(1 − α/2, n − 1) × u_c, when u_c and the measurement bias CI are available |
Relative bias and recovery need a positive assigned value on a ratio scale. Otherwise the result gives the reason they weren't calculated.
Intervals by how results relate
Section titled “Intervals by how results relate”Which intervals a level gets depends on how its results relate. Bias intervals and independent results gives the reasoning.
| Results at a level | Material ID | Day and Run | Mean CI, bias CI and combined uncertainty |
|---|---|---|---|
| Replicates of one material in one run | The same on every row | The same on every row | Calculated from the replicate SD, t(n − 1). They describe that run's repeatability only |
| Repeats of one material across days or runs, such as the 5-day plan | The same on every row | More than one day or run | Not given |
| Repeats of one material without a recorded day or run | The same on every row | Blank on some rows | Not given |
| Separate, independent specimens that share one assigned value | Different on every row | Any | Calculated from all results as independent results |
Sources: NIST/SEMATECH e-Handbook §1.3.5.2 and §1.3.5.6; NIST TN 1297 (1994), uncertainty propagation and coverage factors. See Study reference.
Evidence references: CAP COM.40300, COM.40350 (9 December 2025). In a binder, the CAP evidence index lists the report sections behind each requirement and the laboratory records that go with them.