


Calibration verification reference
Calibration verification checks whether suitable low, middle and high materials give acceptable results against independently assigned concentrations or target ranges. Accuracy and Range coverage are separate saved results. Check linearity adds a separate straight-line question when the concentrations are independently assigned.
Settings
Section titled “Settings”A low, middle and high design follows 42 CFR 493.1255; the laboratory chooses the acceptable limits. CAP's public calibration guidance explains how material coverage and acceptable results support AMR verification. A single result at a level supports a direct point check, but has no SD, mean interval or precision index.
How the values are assigned, under Calibration materials:
| Choice | Values to enter |
|---|---|
| Assigned value for each level | One independently assigned concentration for each level |
| Target range for each level | Inclusive lower and upper limits for every level |
| Dilutions of an assigned high value | The independently assigned concentration at 100%, and each preparation percentage |
| Admixtures between two assigned values | The independently assigned lower and higher concentrations, their percentages, and each preparation percentage |
| Equal steps between two assigned values | Two independently assigned concentrations, their level indices, and each preparation's index |
A blank lower or higher anchor position uses the lowest or highest entered preparation position. Saving fills those positions in. The anchors describe the independent assignments; the measured results do not supply them.
| Setting | Where | What it does |
|---|---|---|
| Total-error allowance in the study unit, Total-error allowance (%) | Accuracy limits (assigned values) | The allowance for every replicate. When both are entered, the larger applies at each target |
| Share for mean bias (%) | Accuracy limits | The share of the total allowance that each level mean must meet. Starts at 50% |
| Check linearity | Additional questions | Fits an unweighted straight line through the level means. Offered with independently assigned values |
| Check the precision index | Additional questions | Compares each level's within-run SD with its random-error allowance |
| Share for random error (%) | Additional questions, with the precision index | Starts at 25% |
| Claimed lower reportable limit, Claimed upper reportable limit | Claimed range | Both together turn on the range coverage check |
| Endpoint proximity allowance (%), endpoint proximity allowance in the study unit | Claimed range | How close a material's target must be to each claimed limit. Defaults to 10% when neither is entered. With both, the larger applies |
Columns
Section titled “Columns”One row per measured replicate.
| Grid column | Required | What to enter |
|---|---|---|
| Level | Yes | A material level matching the plan on Set up |
| Result | Yes | One measured result |
| Replicate | No | Replicate label |
| Material ID | No | Coded material ID. A blank material ID is filled with the level name when saved |
Assigned values, target ranges and the values used to calculate theoretical concentrations are entered on Set up. The grid holds the results. An unreadable or missing result needs its original reading, or an exclusion with a reason, before calculating.
Acceptance limits
Section titled “Acceptance limits”- Assigned values: accuracy requires
|mean − target| ≤ systematic allowanceand|result − target| ≤ total allowancefor every included replicate. Every replicate is checked against the full total allowance: with a total allowance of 10 mg/dL and a 50% share, the mean must be within 5 mg/dL and every replicate within 10 mg/dL. An assigned zero needs a study-unit allowance. - Target ranges: every included replicate must lie inside its stated inclusive range. The midpoint is used only to locate the material for coverage; it is not treated as an assigned accuracy value.
- Range coverage: each claimed limit needs a material whose target falls within its endpoint window. At the lower end, a zero or minimal material from 0 up to the lower limit also covers it, as 42 CFR 493.1255 allows. The material nearest each limit is shown for that end. A distinct interior material must also be present, and every material level must meet its accuracy limits. The displayed middle material is the interior level nearest the claimed midpoint; its position remains visible for laboratory review.
- Check linearity: the systematic-error share supplies the deviation allowance at each fitted concentration, unless a separate deviation limit is entered. A passing line does not replace accuracy or coverage.
- Precision index:
SD / random allowance, with a direct inclusive limit of 1.00.
All comparisons include equality and retain the entered decimal values. Confidence intervals describe uncertainty; they do not enlarge a typed acceptance limit.
Results and plots
Section titled “Results and plots”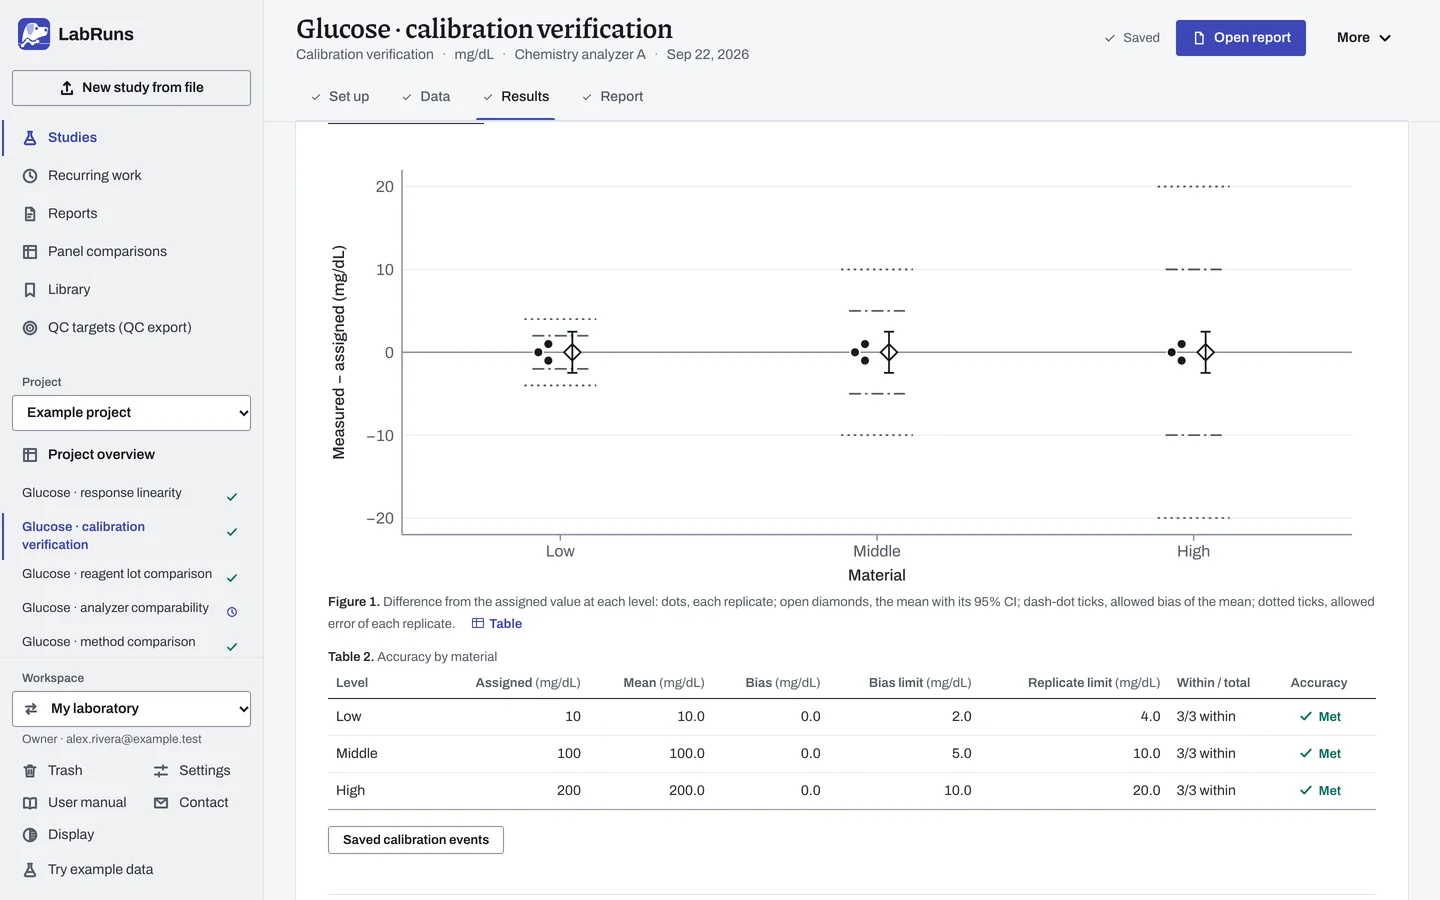
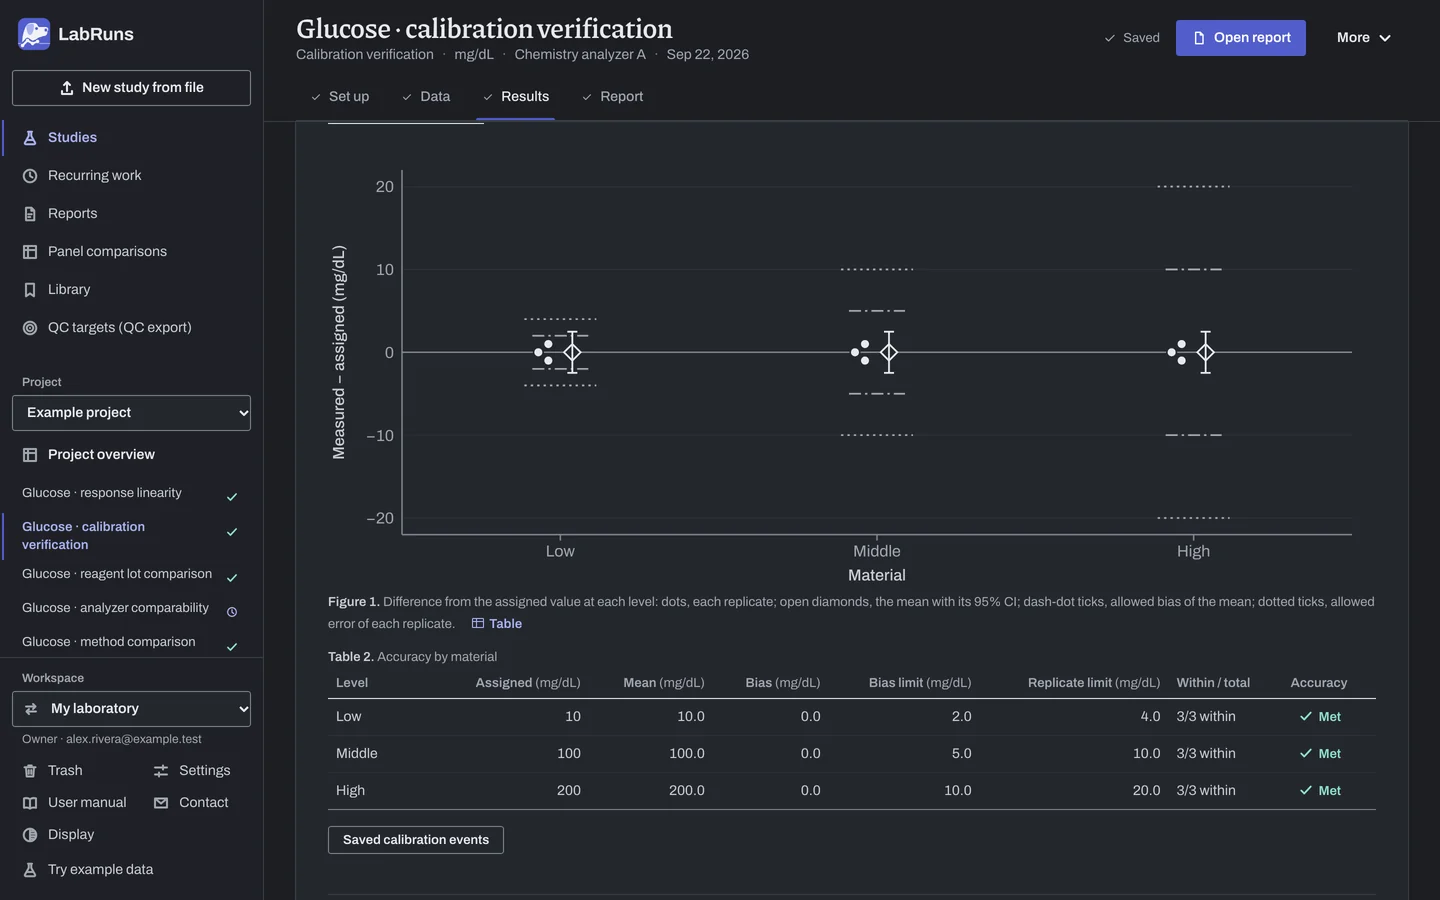
The decision page leads with Accuracy and Range coverage, then each material's mean and replicate outcome. A failed replicate cannot be hidden by a passing mean. A material outside an endpoint window cannot verify that endpoint even when its accuracy is acceptable; at the lower end, a zero or minimal material at or below the limit can.
Supporting evidence includes the within-run SD, the mean confidence interval, optional precision-index intervals and the individual replicate decisions.
Example
Section titled “Example”The example Glucose · calibration verification contains three replicates at each assigned concentration: 9, 10 and 11 against 10; 99, 100 and 101 against 100; and 199, 200 and 201 against 200 mg/dL.
With total error set to the larger of 4 mg/dL or 10%, and a 50% systematic share, the saved result gives:
| Level | Mean (mg/dL) | Mean-bias allowance (mg/dL) | Replicate allowance (mg/dL) | Within allowance |
|---|---|---|---|---|
| Low | 10 | 2 | 4 | 3 of 3 |
| Middle | 100 | 5 | 10 | 3 of 3 |
| High | 200 | 10 | 20 | 3 of 3 |
Every mean has zero bias. All levels meet accuracy, and the claimed 10–200 mg/dL range is covered with the default endpoint allowance. If the final high replicate is corrected to 221 mg/dL, the high mean still meets its 10 mg/dL bias allowance, but that replicate's error is 21 mg/dL against 20 mg/dL. Accuracy does not meet the limit.
Calculations and sources
Section titled “Calculations and sources”When you calculate Glucose · calibration verification in the example project, LabRuns records these methods:
- Independent assigned values or target ranges determine accuracy; measured results never assign their own accuracy targets.
- Total-error allowance is the larger of the entered concentration allowance and percentage of the assigned value. Systematic and random allowances are their entered shares of total error.
- Mean bias and every replicate are compared directly with inclusive laboratory limits. A confidence interval does not relax a typed limit.
- Assigned-high dilution uses percent × assigned high / 100. Two assigned anchors use linear interpolation in the entered percentages or level indices.
- Target-range midpoints locate materials for coverage only; no mean bias is calculated from a range midpoint.
- Range coverage needs a material covering each end, a distinct interior material, and acceptable accuracy at every planned level. A material covers an end inside its endpoint window, limit ± max(concentration allowance, percentage × |limit| / 100), with 10% for a blank allowance; a minimal or zero material from zero up to the lower limit also covers the lower end. Of the covering materials, the one nearest the limit covers that end.
- Means and sample SDs summarize within-run replicates. Mean confidence intervals use Student t and n − 1 degrees of freedom.
Two-anchor interpolation uses expected = low + (position − low position) × (high − low) / (high position − low position). Thus anchors at 20% = 200 and 100% = 600 give 350 at 50%.
The precision index's two-sided 90% interval multiplies the index by the square root of (n − 1) / chi-square quantile, using quantiles 0.95 and 0.05; more replicates give a narrower interval. The NIST variance-interval specification supplies this interval method.
Evidence references: CAP COM.40300, COM.40350, CHM.13550, CHM.13600, HEM.37373, HEM.37375, IMM.33800, IMM.33818, MIC.65160, MIC.65170, POC.08500, POC.08600 (9 December 2025). In a binder, the CAP evidence index lists the report sections behind each requirement and the laboratory records that go with them.