


Repeatability reference
For each level, a repeatability study reports the mean, repeatability SD and CV, with a confidence interval for the mean. See repeatability in the glossary.
Settings
Section titled “Settings”Several levels, for example a low and a high control, can share one study. Each level is calculated separately and needs one material, one day and one run. Analyte and Unit are required. Confidence level, Measurement scale and Permit negative results are calculation settings.
Manufacturer claim verification
Section titled “Manufacturer claim verification”Manufacturer precision claims (optional) holds one claim value per row: the level, the claim concentration and the manufacturer's SD or CV. The claim is a repeatability claim. A CV is converted to SD at the included level mean. One-sided confidence starts at 95%.
Columns
Section titled “Columns”| Column | Required? | What to enter |
|---|---|---|
| Specimen / material ID | Once per level | For example QC-001. Saving fills it in on the level's other rows; with none, the level is named Level 1 |
| Result | Yes | Each replicate's measured value, in the study unit |
| Level | No | The control level. A file without a Level column names the level after its material ID; a row added by hand starts at 1 |
| Day, Run | No | Only in an imported file. Leave the columns out and both become 1 |
| Replicate | No | Unique within a level |
| Excluded, Exclusion reason | No | True and a reason to exclude a row at import |
In Import a file, the column uses are Specimen or material ID, Result, Level or group, Day, Run and Replicate. A row added by hand starts with level 1 and its row number as the replicate. When the study is saved, a blank material ID takes the ID typed above it in the same level.
The calculation stops when:
- a level mixes materials, or an imported file gives a level more than one day or run.
- a replicate number repeats within a level.
- a row is marked: a blank or non-numeric result, a missing level, an imported row with a blank day or run, a negative result while Permit negative results is off, or an exclusion without a reason.
- the analyte or unit is blank.
Acceptance limits
Section titled “Acceptance limits”- An SD limit can use the study unit, a percentage of the level mean, or both. With the larger-allowance choice, the limit is the greater of the two. The saved result shows the resolved SD allowance at each mean. On an interval scale, Pass only when within both is Not met when the SD fails its study-unit allowance and Undecided otherwise.
- An analyzer profile can prefill this limit from the random share of its allowable error. See About allowable error.
- Repeatability SD and Repeatability CV limits compare each level's own estimate using the entered decimal results before display rounding. Equality meets an inclusive limit.
- A limit needs at least 2 included replicates in the level; with 1 it is Undecided.
- A CV limit needs a ratio scale (Measurement scale, the default). On an interval scale, with no meaningful zero, a CV limit is Undecided.
- The manufacturer claim comparison is a separate question. A laboratory limit remains Not met when its observed result exceeds it, even if the manufacturer claim comparison is consistent.
- A limit that is Not met makes the whole study Criteria not met.
See Set acceptance limits, including More statistics, and About acceptance decisions.
Results and plots
Section titled “Results and plots”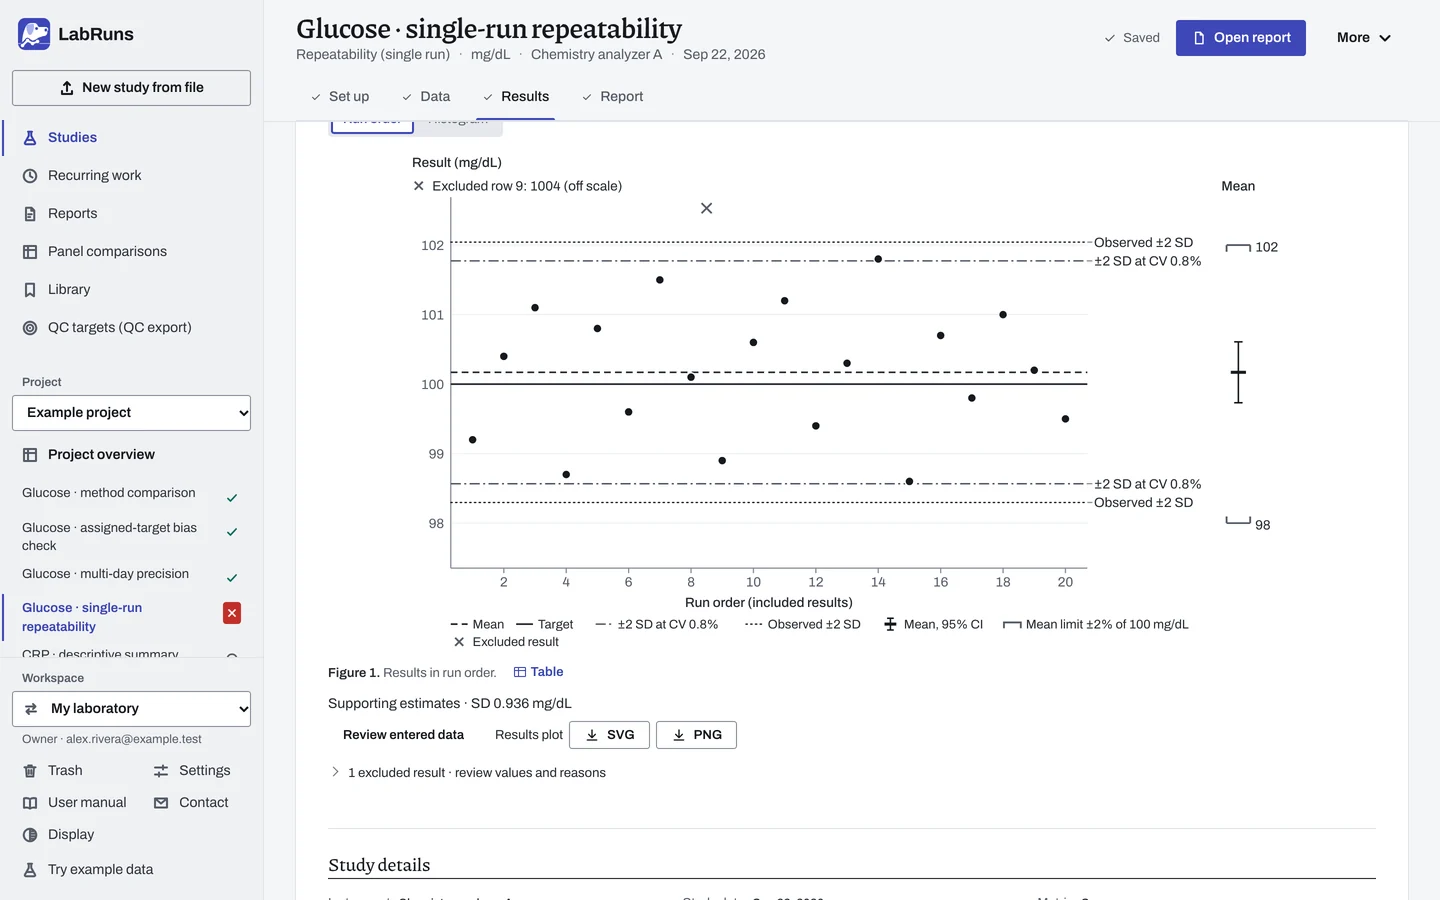
- The acceptance table below the verdict: each limit with its observed value and outcome. Each line opens that limit on Set up.
- Results: the mean with its confidence interval, SD and CV for each level, arranged as described in Reading results. The count is in the verdict line.
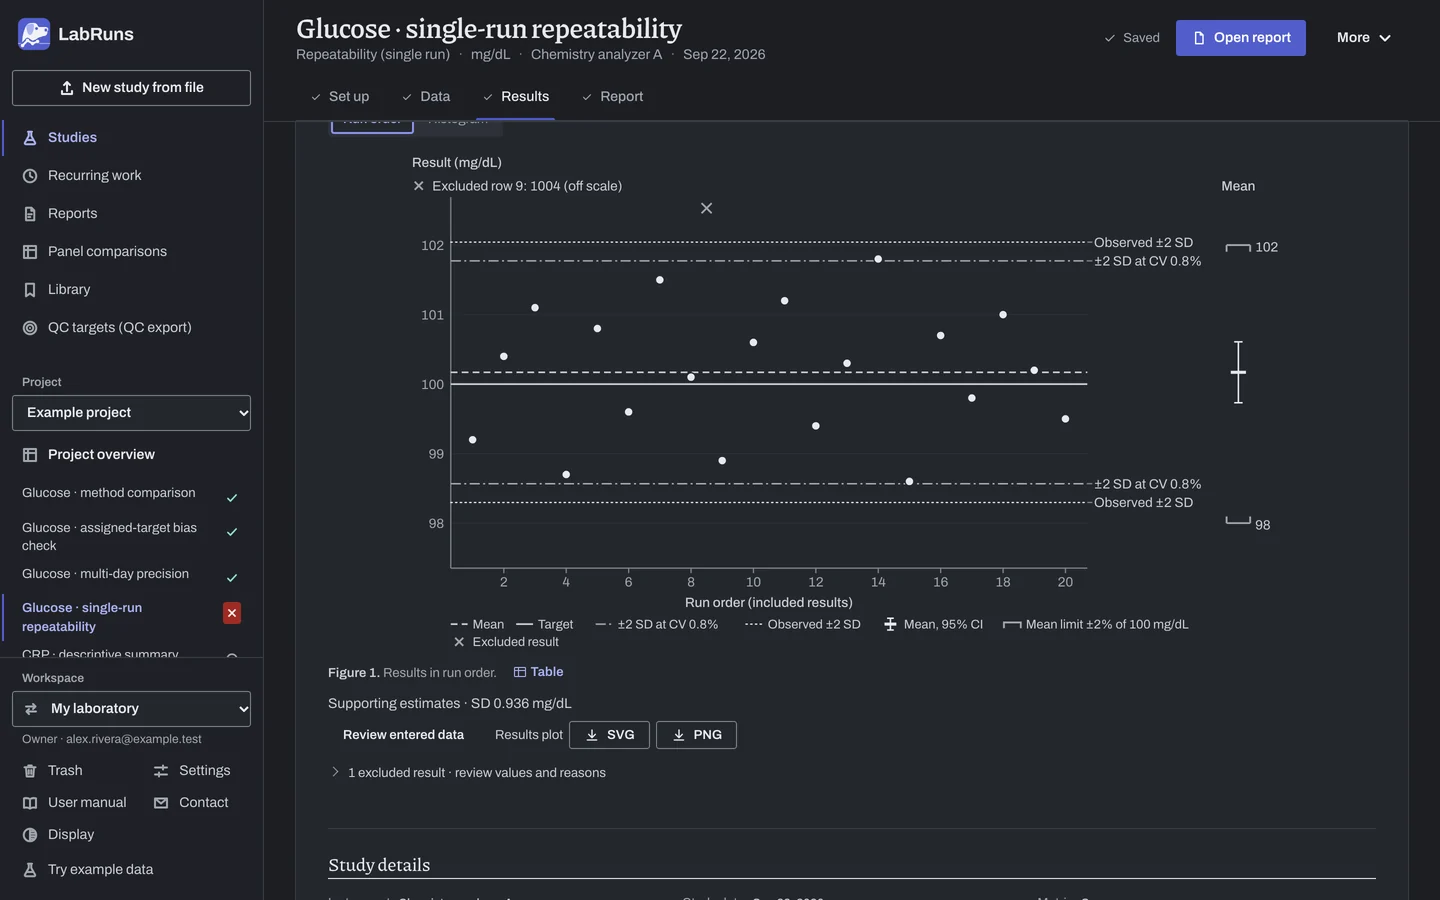
- The results plot: replicates in run order (or Histogram) with the mean as a dashed line.
- Additional statistics: median, variance, quartiles and the mean CI.
- Supporting diagnostics: the distribution, a normal Q–Q plot, and a box plot with every result.
- The manufacturer claim comparison: the claimed SD, verification limit and Consistent with the claim or Higher than the claim. The precision summary gives the observed SD.
Example
Section titled “Example”The study Glucose · single-run repeatability in the example project uses repeatability.csv: 21 rows of material QC-001 at level 1, day 1, run 1. One row, result 1004 with replicate E1, is excluded as a transcription error.
Settings: analyte Glucose, unit mg/dL, 95% confidence. Two limits:
- Within-run CV: Sample CV ≤
0.8%. - Mean near assigned value: Mean within
2% of an assigned value of100mg/dL.
| Estimate | Displayed value |
|---|---|
| Count (verdict line) | 20 analyzed · 1 excluded |
| Mean | 100.17 mg/dL |
| 95% CI for mean | 99.73–100.61 mg/dL |
| SD | 0.936 mg/dL |
| Within-run CV | 0.93% |
| Median | 100.25 mg/dL |
| Lowest–highest | 98.6–101.8 mg/dL |
| Criterion | Observed | Acceptance limit | Outcome |
|---|---|---|---|
| Within-run CV | 0.93% | ≤ 0.8% | Not met |
| Mean near assigned value | 100.17 mg/dL | ±2% of 100 mg/dL | Met |
The study status, and page 1 of the report, read Criteria not met because of the within-run CV.
Calculations and sources
Section titled “Calculations and sources”When you calculate Glucose · single-run repeatability in the example project, LabRuns records these methods:
- Arithmetic mean, and sample SD with an n − 1 denominator.
- Quantiles use linear interpolation (Hyndman–Fan type 7). The histogram has ⌈√n⌉ equal-width bins, at most 40.
- Two-sided 95% Student t CI for the mean.
- Results are grouped by concentration level. Every included result is used.
- Criteria evaluate the unrounded estimates.
- SD allowances using a percentage require a ratio scale. With both limits required on an interval scale, a failed study-unit requirement fails the criterion; otherwise it is undecided.
- Distribution diagnostics: ordered values plotted against standard-normal quantiles at Blom positions pᵢ = (i − 3/8)/(n + 1/4).
- Box: type-7 quartiles, IQR = Q3 − Q1. Whiskers end at the most extreme values within Q1 − 1.5 IQR and Q3 + 1.5 IQR. Values beyond the whiskers stay in the analysis.
- Q–Q and box plots need at least 3 values that are not all identical. The strip plot shows every included value.
For each level:
| Estimate | How it is calculated |
|---|---|
| Repeatability CV | 100 × SD / mean, on a ratio scale, with a positive mean and no negative results |
| Minimum, Maximum | Smallest and largest included replicate |
| Mean CI | mean ± t(1 − α/2, n − 1) × SD / √n. It describes the mean of this run |
Manufacturer claim verification limit
Section titled “Manufacturer claim verification limit”The verification limit is claimed SD × √[χ²(confidence, ν) / ν]. This comparison assumes normally distributed measurement error. For a single run, ν is the number of included replicates minus one.
Sources: NIST/SEMATECH e-Handbook §1.3.5.6 and §1.3.5.2. See Study reference.
Evidence references: CAP COM.40300, COM.40350 (9 December 2025). In a binder, the CAP evidence index lists the report sections behind each requirement and the laboratory records that go with them.