


Detection limits reference
A detection limits study establishes from its data, or verifies against a claim, one of three limits: the limit of blank (LoB), the limit of detection (LoD) or the limit of quantitation (LoQ). One study covers one limit and one objective. About detection limits explains what the limits mean and how they relate.
Settings
Section titled “Settings”| Setting | Where | What it does |
|---|---|---|
| Which limit | New study | LoB, LoD or LoQ |
| Objective | Detection capability | Establish from study data or Verify a claimed limit |
| Claimed LoB, Claimed LoD, Claimed LoQ | Detection capability, when verifying | The claimed limit |
| LoB source | Detection capability, for the LoD | Estimate from blank rows in this study, or Use a stated LoB with Stated LoB |
| Goal type | Quantitation goal, for the LoQ | Imprecision · CV, Bias and imprecision · |bias| and CV or Total error · (|bias| + k·SD) / assigned, with CV goal (%), Bias goal (%) or Total-error goal (%) |
| SD multiplier k | Quantitation goal | The k in the total-error goal. Starts at 2 |
| Stated LoD (optional) | Quantitation goal | A floor: the LoQ can't be below it |
| α · false-positive error probability | Calculation options, when the LoB is estimated | The share of blank results expected above the LoB. 0.05 |
| β · false-negative error probability | Calculation options, for the LoD | The share of results at the LoD expected at or below the LoB. 0.05 |
| LoB method | Calculation options | Nonparametric · empirical percentile (preset) or Parametric · mean + z·SD (Gaussian) |
| Censored results | Calculation options | Rank “<” results below exact results (preset) or Treat “<” results as row errors; see Censored results |
| Permit negative results | Calculation settings | Starts ticked, because blank readings are often negative |
| Confidence level | Calculation settings | Sets the confidence intervals. 95 % |
Calculation options is closed by default.
Rows each mode uses
Section titled “Rows each mode uses”Blank materials have the role blank and low-level materials the role low.
| Mode | Uses | Ignores |
|---|---|---|
| LoB (establish or verify) | blank rows | low rows |
| LoD with an estimated LoB | blank and low rows | none |
| LoD with a stated LoB | low rows | blank rows |
| LoQ | low rows with a positive assigned concentration | blank rows |
Columns
Section titled “Columns”| Column use | Grid column | Required | What to enter |
|---|---|---|---|
| Specimen or material ID | Material ID | Yes | Coded ID of the blank or low-level material. Each material has one role and one assigned concentration |
| Sample role | Role | Yes | blank (analyte-free material) or low (low-level material), any case |
| Result | Result | Yes | The measured value. Blanks often give negative values |
| Expected (assigned) value | Assigned concentration | For LoQ low materials and LoD verification | The material's assigned concentration. Above zero for low materials in an LoQ study |
| Lot | Reagent lot | No | One lot for the whole study; a blank cell is the study's reagent lot |
Censored results
Section titled “Censored results”A result such as <0.01 is ranked below every exact result, never replaced by a number:
- Nonparametric LoB: censored blanks take the lowest ranks. This works when every exact blank is at or above the bounds and the percentile falls above the censored results.
- LoB verification: a bound at or below the claim counts as at or below the claim.
- Parametric LoB: can't be calculated, because a mean and SD need exact values.
- LoD: low-level results must be exact.
- LoQ: the material becomes indeterminate.
With Treat “<” results as row errors under Calculation options, Censored results, < results are row errors. Results starting with > or ≥ are always row errors. See Missing and censored values.
Acceptance limits
Section titled “Acceptance limits”Enter your own limit offers the estimated LoB, LoD or LoQ when establishing and the Verification share when verifying an LoB or LoD. The dialog and its choices are in Set acceptance limits.
- Establishing: the limit is the largest acceptable estimate. An LoD study with an estimated LoB can also limit the LoB, under More statistics, Limit of blank.
- Verifying an LoB or LoD: the Verification share is the smallest acceptable share.
- Verifying an LoQ: no limit applies. The quantitation goal at the claimed LoQ decides and is listed as Quantitation goal at the claimed LoQ.
- A limit that doesn't fit the study, for example an LoB limit when the LoB is stated, is Not applicable.
- An LoD or LoQ limit needs at least 2 low materials, and a share limit at least 2 results. With fewer, the limit is Undecided. So is an LoQ limit when no LoQ was reached. Either way, an LoQ limit at or below the concentration of a material that missed the goal reads Not met: every higher material must meet the goal, so the LoQ can't be that low. See About acceptance decisions.
- Without a Verification share, an LoB or LoD verification shows its share but gives no pass or fail, and a note says verification is not decided.
Results and plots
Section titled “Results and plots”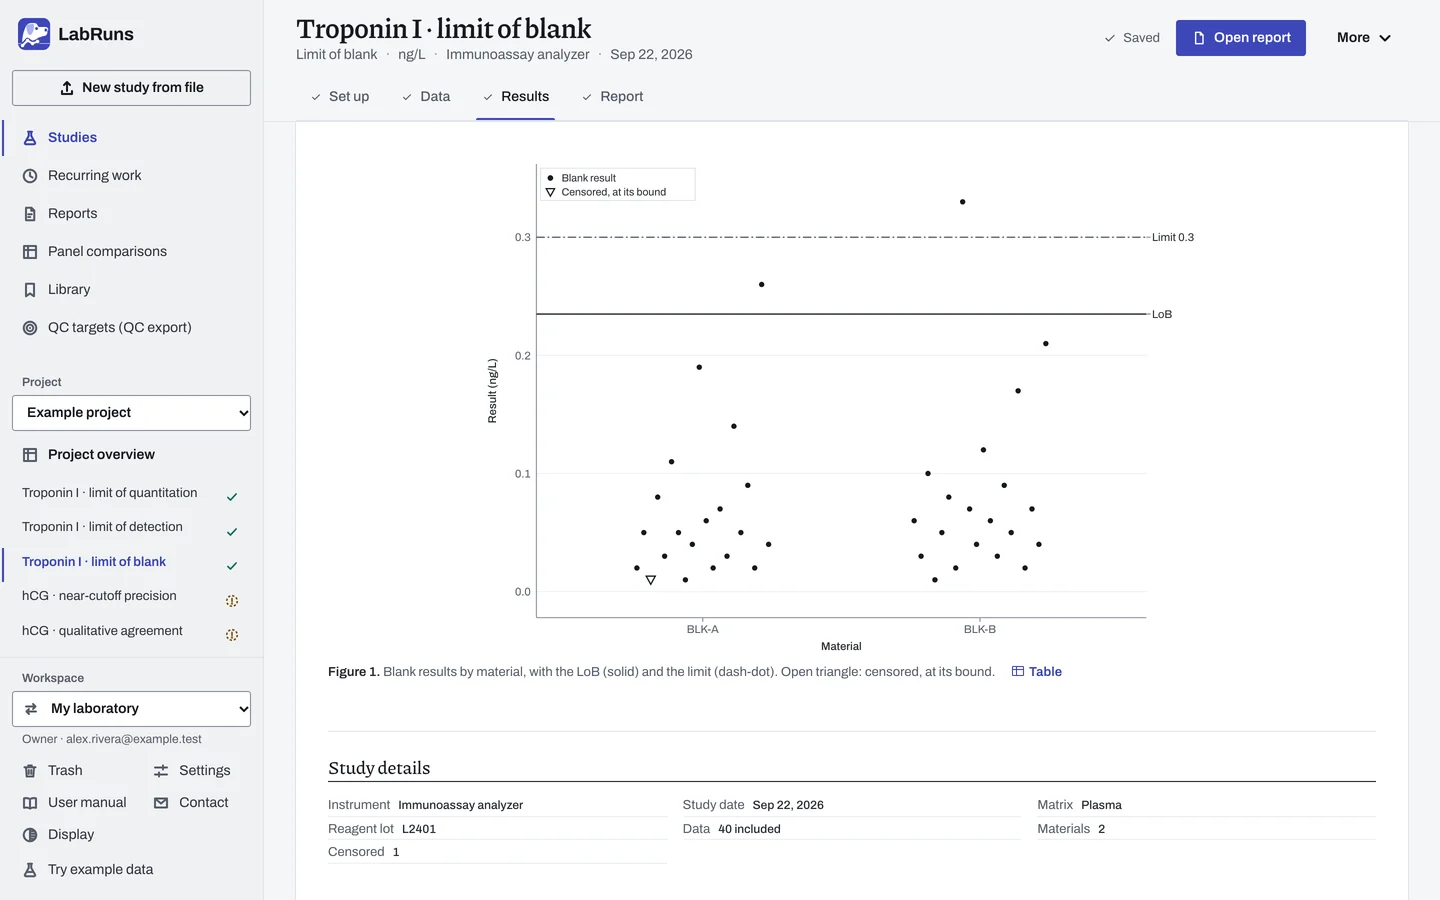
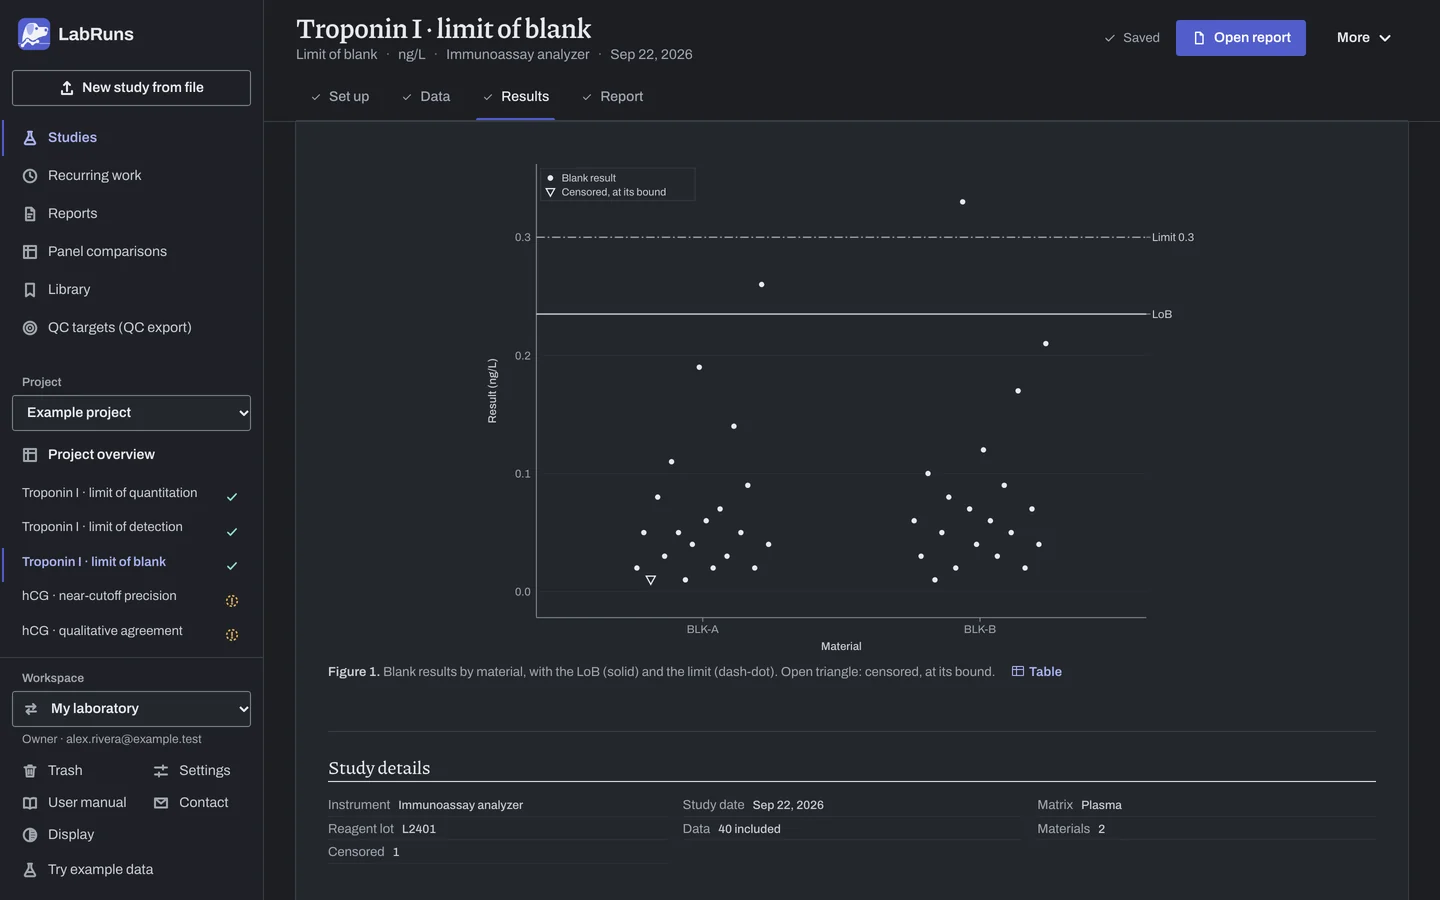
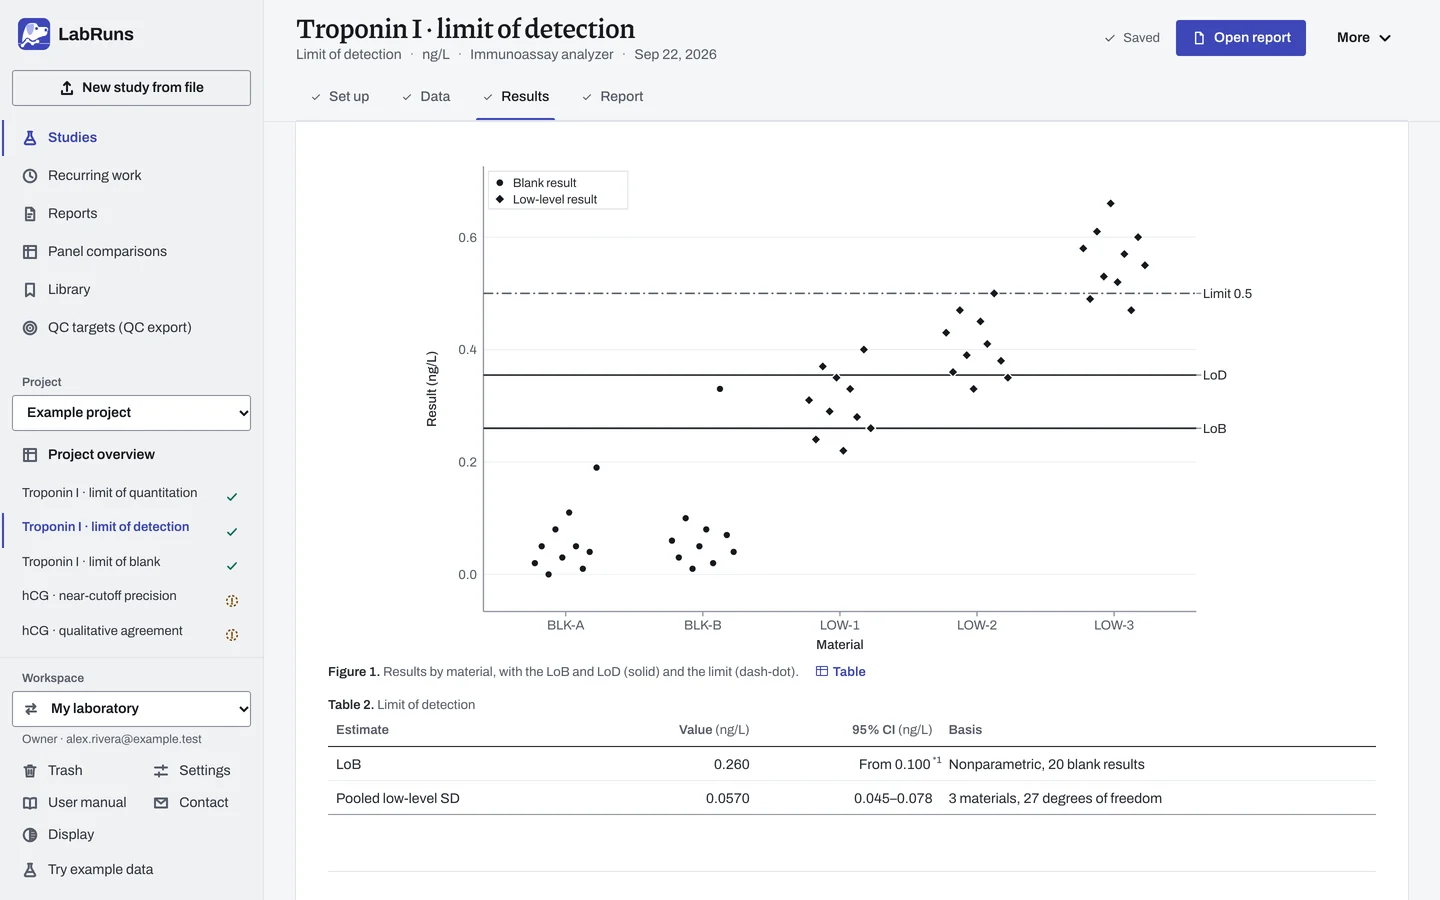
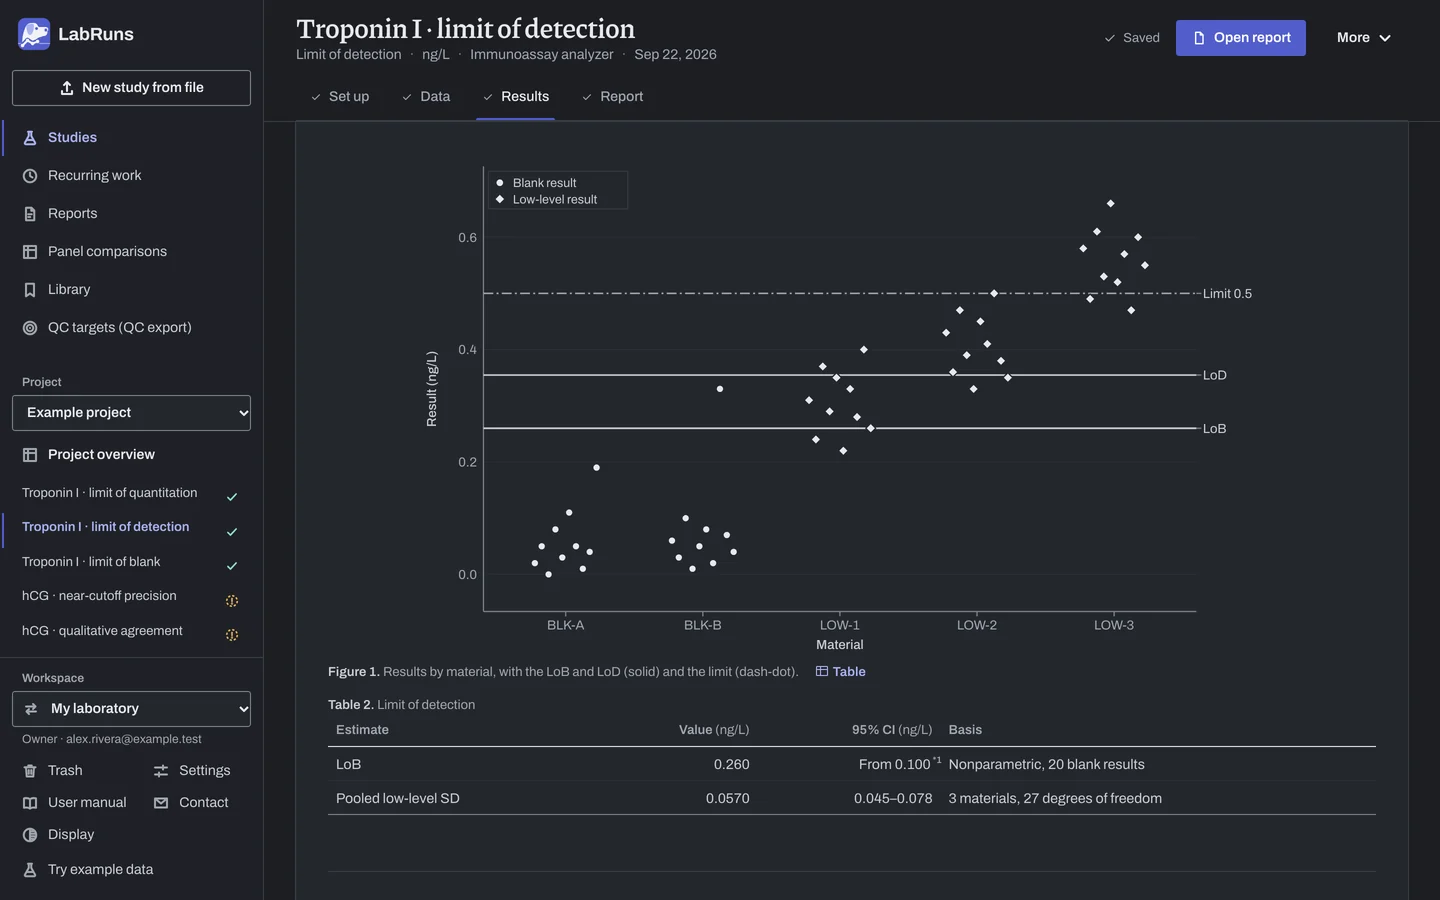
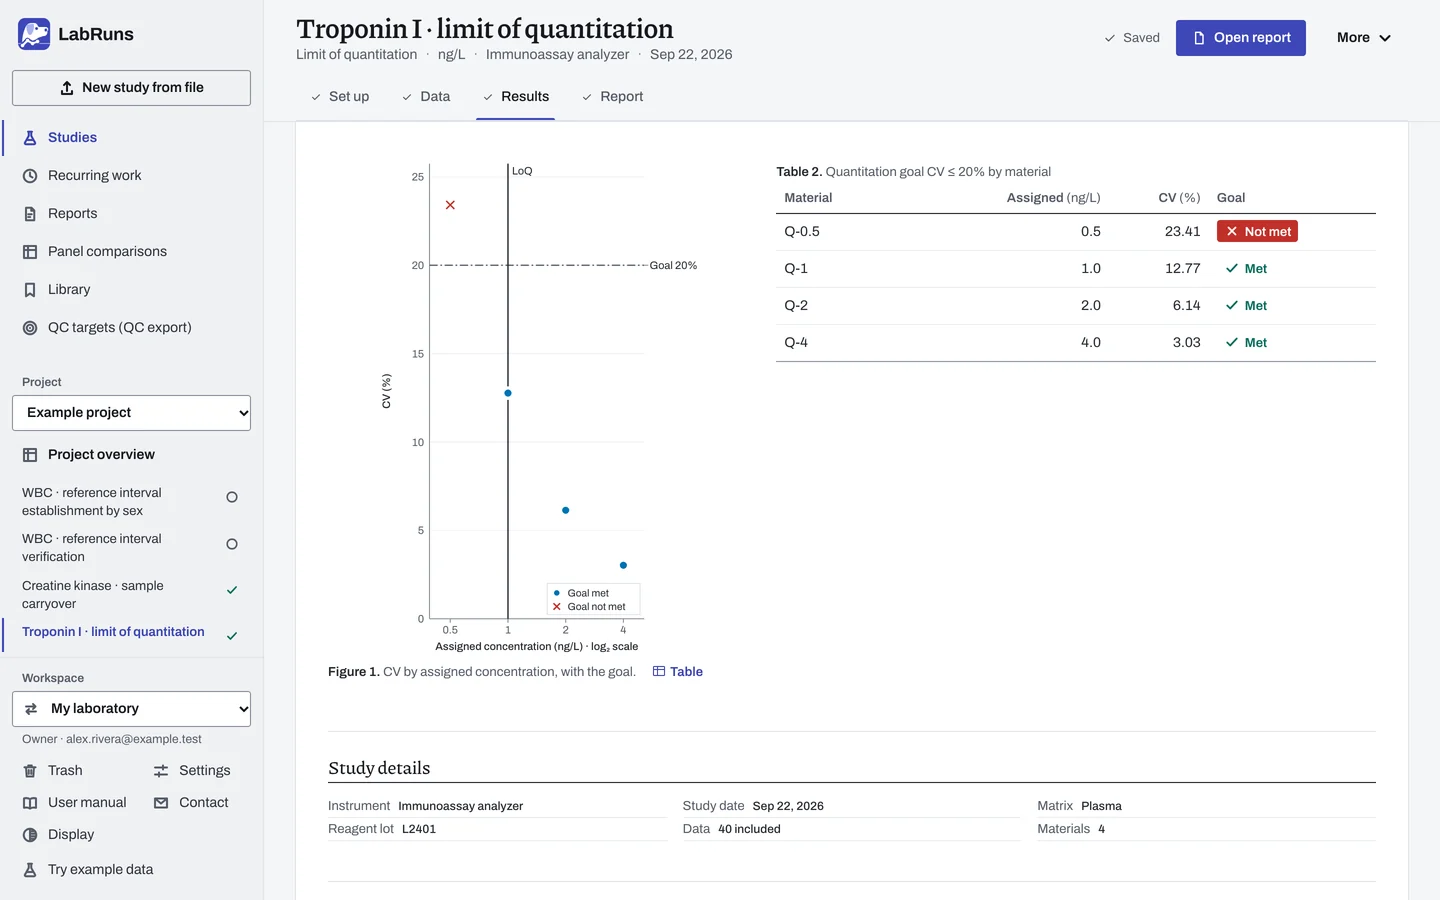
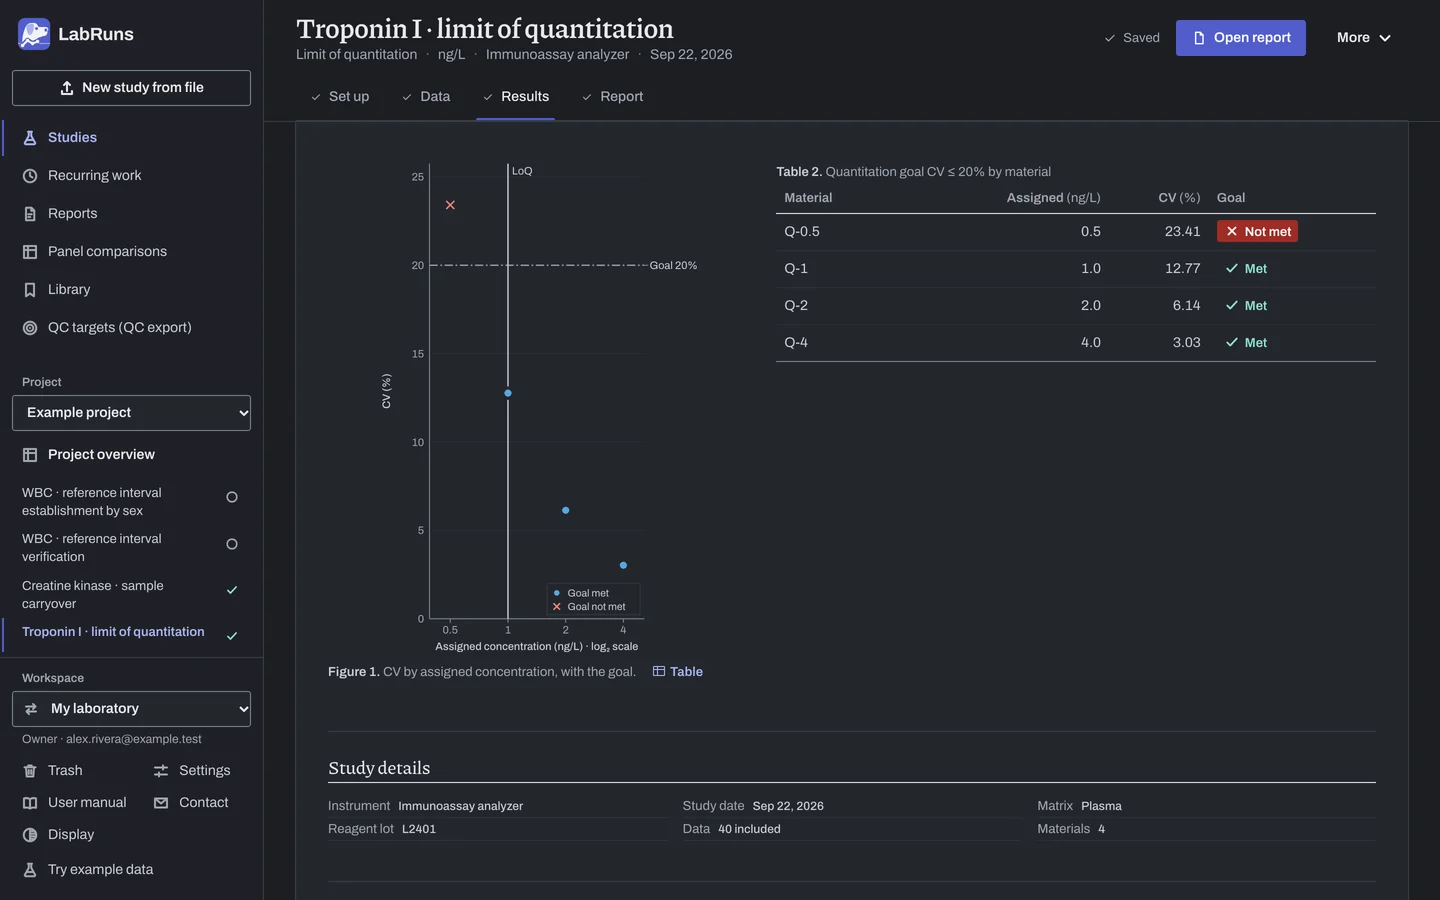
For an LoB or LoD, the plot shows each result by material: circles for blanks, diamonds for low materials, open triangles for censored values at their bound. Solid lines mark the LoB, LoD or claim, and a dashed line the acceptance limit. The table beside it, Limit of blank or Limit of detection (when verifying, Blank results against the claimed LoB … or Results at the claimed LoD …), holds the estimate or the share. For an LoQ, the precision profile sits beside Quantitation goal … by material. Under Results, the materials and Calculation settings record what was used, and Detailed statistics lists Blank materials, Low-level materials or Material results and goal status.
- LoB and its CI. An interval end that can't be estimated reads "not estimable", and a note says how many blank results it needs. The blank mean, median and SD are listed.
- LoD multiplier. The results list
z(1−β)andc_β. - SD_L. The pooled low-level SD, with each material's SD and the ratio of the largest to the smallest.
- LoD. A note appears if it lies outside the studied materials.
- Detection share (verification). For an LoB, the share of blanks at or below the claim. For an LoD, the share of low results above the LoB. The share implied by α or β is for reference.
- Precision profile (LoQ). CV or total error for each material against the dashed goal line: circles meet the goal, crosses don't.
LoQ verification verdicts: Goal met at the claimed LoQ, Goal not met at the claimed LoQ, Indeterminate at the claimed LoQ, or Claim below the stated LoD.
Example
Section titled “Example”Three example troponin I files (ng/L, reagent lot L2401), Permit negative results ticked for the LoB and LoD, α = β = 0.05, 95 %. A limit's outcome reads Met, Not met or Undecided; the study reads Criteria met, Criteria not met or Undecided.
LoB, established. detection_lob.csv: 40 blank results, 20 each on BLK-A and BLK-B. Nonparametric. Acceptance limit: Limit of blank ≤ 0.3 ng/L.
| Result | Saved value |
|---|---|
| LoB (95th percentile of blank results) | 0.235 ng/L |
| 95% CI for LoB | Lower limit 0.140, upper limit not estimable |
| Blank mean / median / SD | 0.075 / 0.050 / 0.0706 ng/L |
| Blank minimum / maximum | 0.000 / 0.330 ng/L |
| Distinct exact blank values | 19 |
| LoB (limit ≤ 0.3 ng/L) | Met (0.235 ng/L). Study: Criteria met |
The percentile position is 0.5 + 40 × 0.95 = 38.5, halfway between the 38th sorted blank (0.21) and the 39th (0.26). An upper confidence limit needs 72 blanks, so 40 give none, and a note says so. With Parametric · mean + z·SD (Gaussian) the LoB is 0.191 ng/L, 95 % CI 0.156–0.226. That assumes normally distributed blanks. Here the mean, 0.075, is above the median, 0.050, which suggests skew.
The example project's Troponin I · limit of blank reports one BLK-A blank as <0.01. It takes the lowest rank, so the LoB and its interval are unchanged. That study lists 18 distinct exact values, notes the censored result, and has no blank mean, SD or minimum, so its LoB method stays nonparametric.
LoB, verified. Same file, Claimed LoB 0.3, acceptance limit Verification share ≥ 90 %:
| Result | Saved value |
|---|---|
| Blank results (N) / results ≤ claimed LoB | 40 / 39 |
| Share ≤ claimed LoB | 97.50% (95 % Wilson CI 87.12–99.56%) |
| Share implied by α (descriptive reference) | 95.00% |
| Estimated LoB (descriptive) | 0.235 ng/L |
| Verification share (limit ≥ 90%) | Met (97.50%). Study: Criteria met |
LoD, established. detection_lod.csv: 20 blanks (BLK-A, BLK-B) and 10 results each on LOW-1 (assigned 0.30), LOW-2 (0.40) and LOW-3 (0.55). Estimated nonparametric LoB. Acceptance limit: Limit of detection ≤ 0.5 ng/L.
| Result | Saved value |
|---|---|
| LoB (95th percentile of blank results) | 0.260 ng/L (95 % CI: lower limit 0.100, upper limit not estimable) |
| Pooled low-level SD (SD_L) | 0.0570 ng/L (95 % chi-square CI 0.0451–0.0776), 27 degrees of freedom |
| z(1−β) | 1.644854 |
| LoD multiplier c_β = z(1−β) / (1 − 1/(4·df)) | 1.660226 |
| LoD = LoB + c_β·SD_L | 0.355 ng/L |
| Material SDs | LOW-1 0.0580, LOW-2 0.0552, LOW-3 0.0579; the largest is 1.051 times the smallest |
| LoD (limit ≤ 0.5 ng/L) | Met (0.355 ng/L). Study: Criteria met |
The LoB position is 0.5 + 20 × 0.95 = 19.5, halfway between the 19th sorted blank (0.19) and the 20th (0.33). The LoD, 0.355 ng/L, lies between the material means (0.305 to 0.558 ng/L); a note appears when it falls outside them. With a stated LoB of 0.2 ng/L, the LoD is 0.295 ng/L.
LoD, verified. Claimed LoD 0.4 ng/L, acceptance limit Verification share ≥ 90 %:
- With only the blanks and
LOW-2(assigned 0.4): 10 of 10 low results exceed the LoB 0.260 ng/L, share 100.00% (95 % Wilson CI 72.25–100.00%), Met. - On the full file,
LOW-1(0.3) andLOW-3(0.55) are off the claim, so the outcome is Undecided even though the share would meet it.
LoQ, established. detection_loq.csv: 10 results each on Q-0.5, Q-1, Q-2 and Q-4 (assigned 0.5, 1, 2 and 4 ng/L). Imprecision · CV, CV goal (%) 20. Acceptance limit: Limit of quantitation ≤ 1.5 ng/L.
| Material | Assigned | Mean | SD (95 % CI) | CV (%) | Bias (%) | Goal status |
|---|---|---|---|---|---|---|
| Q-0.5 | 0.5 | 0.519 | 0.122 (0.0836–0.222) | 23.41 | +3.80 | does not meet goal |
| Q-1 | 1 | 1.030 | 0.131 (0.0904–0.240) | 12.77 | +3.00 | meets goal |
| Q-2 | 2 | 2.005 | 0.123 (0.0846–0.225) | 6.14 | +0.25 | meets goal |
| Q-4 | 4 | 4.029 | 0.122 (0.0838–0.223) | 3.03 | +0.73 | meets goal |
The LoQ is 1 ng/L: Q-1 and every higher material meet the goal. The limit is Met; the study status is Criteria met.
| Goal type and values | Saved LoQ | Why |
|---|---|---|
| Bias and imprecision: CV ≤ 10 % and absolute bias ≤ 5 % | 2 ng/L | Q-1 fails: CV 12.77% exceeds 10 %. The ≤ 1.5 ng/L limit is then Not met. |
| Total error: TE ≤ 30 %, k = 2 | 1 ng/L | Q-1 TE 29.30% meets 30 %. Q-0.5 TE 52.41% does not. |
LoQ, verified. Claimed LoQ 1 ng/L with CV ≤ 20 %: Goal met at the claimed LoQ (CV 12.77 %). The limit Quantitation goal at the claimed LoQ is Met; the study status is Criteria met.
Calculations and sources
Section titled “Calculations and sources”- Detection share
= 100·count/Nwith a two-sided Wilson score interval (NIST/SEMATECH §7.2.4.1).
Study-design reference: NIST SD interval. See Study reference.
Limit of blank
Section titled “Limit of blank”When you calculate Troponin I · limit of blank in the example project, LabRuns records these methods:
- Formulas per Armbruster & Pry (Clin Biochem Rev 2008) and Linnet & Kondratovich (Clin Chem 2004). LoB = mean_blank + z(1−α)·SD_blank. LoD = LoB + c_β·SD_low with c_β = z(1−β)/(1 − 1/(4·df)), df the degrees of freedom of the pooled low-level SD. LoQ = the lowest concentration, at or above the LoD, that meets the quantitation goal. z values are standard normal quantiles: z(1−α) = 1.6449 at α = 0.05, z(1−β) = 1.6449 at β = 0.05.
- The nonparametric LoB is the result at position 0.5 + N·(1−α) in the sorted blank results, interpolated linearly between the two order statistics it falls between (Linnet & Kondratovich 2004), with an exact binomial order-statistic CI and its achieved coverage.
- Left-censored results (<x or ≤x) stay censored. Under the rank-below policy they take the lowest ranks of a nonparametric LoB when every exact result is at or above the largest bound, or count as at or below a claimed LoB when the bound is at or below the claim. Otherwise they stop the analysis or leave a LoQ material indeterminate.
- Each study uses one reagent lot.
- Decisions come only from acceptance criteria or, for a LoQ, the quantitation goal on Set up.
- With 60 blanks at α = 0.05 the nonparametric position is 57.5, the mean of the 57th and 58th sorted results. The position must fall within the results, so N ≥ 10 at α = 0.05.
- Parametric LoB CI:
± t(N−1)·SD·√(1/N + z²/(2(N − 1))), a normal-theory approximation.
Limit of detection
Section titled “Limit of detection”When you calculate Troponin I · limit of detection in the example project, LabRuns records the methods above and these:
- Pooled low-level SD_L = √(Σ(n_i−1)s_i² / Σ(n_i−1)) over materials with at least 2 exact results. Its chi-square CI is [s√(df/χ²_{(1+c)/2,df}), s√(df/χ²_{(1−c)/2,df})] (NIST/SEMATECH §1.3.5.8).
- The pooled SD's degrees of freedom are
df = Σ(nᵢ − 1).
Limit of quantitation
Section titled “Limit of quantitation”When you calculate Troponin I · limit of quantitation in the example project, LabRuns records the methods above and these:
- Per material: CV% = 100·SD/mean, bias = mean − assigned, bias% = 100·bias/assigned, TE% = 100·(|bias| + k·SD)/assigned. The SD CI uses chi-square (NIST/SEMATECH §1.3.5.8). A material with fewer than 2 exact results, censored results, zero SD, or a zero or negative mean is indeterminate.
- Goal checks compare point estimates from the entered decimal results with the goal, before display rounding. A value equal to the goal meets it.
- LoQ rule. The LoQ is the lowest tested concentration where that material and all higher ones meet the goal, at or above any stated LoD. A note flags a lower material that passes while a higher one fails.
Evidence references: CAP COM.40350, MIC.64960 (9 December 2025). In a binder, the CAP evidence index lists the report sections behind each requirement and the laboratory records that go with them.