


Near-cutoff precision reference
Near its cutoff, a qualitative test can call the same sample positive one time and negative the next. Near-cutoff precision reports the hit rate, the share of positive results, at each tested concentration. It fits an S-shaped (probit) curve to estimate C5, C50 and C95: the concentrations at which the test calls positive 5 %, 50 % and 95 % of the time. Each estimate has a confidence interval. The span from C5 to C95 is the uncertain zone.
Settings
Section titled “Settings”All on Set up under Qualitative performance, except the confidence level. Study mode is already Near-cutoff binary precision (C5/C50/C95).
| Setting | Default | Meaning |
|---|---|---|
| Result categories · declared order | negative, positive |
Exactly two. While they are still the starting negative, positive and your results use other labels, such as Not detected and Detected, the categories are taken from your results when you save or calculate |
| Positive category | Chosen from the labels | One of the two categories. The report's study details print it under Positive category |
| Nonreportable labels | equivocal, invalid, indeterminate |
Counted for each concentration and left out of the hit rate. Case and surrounding spaces are ignored |
| Concentration scale | Linear concentration | Linear concentration or log10 concentration (values above 0). The scale changes the estimates |
| Assay cutoff (optional) | Blank | Shown beside the C5–C95 interval for comparison |
| Confidence level | 95 % | Under Calculation settings: 90 %, 95 % or 99 % |
With two categories, the Positive category is chosen from the labels themselves, whatever order the rows are in: + beside -, 1 beside 0, Present beside Absent, Detected beside Not detected, Reactive beside Nonreactive, or any label containing positive. Labels the software cannot read either way (such as A and B) take the second as positive.
Columns
Section titled “Columns”One row per replicate test:
| Column use | Grid column | Required | What to enter |
|---|---|---|---|
| Specimen or material ID | Sample ID | Yes | Coded sample ID |
| Expected (assigned) value | Concentration | Yes | The sample's known concentration. Above zero on the log10 scale |
| Result | Result category | Yes | The test's result for this replicate: a declared category or nonreportable label |
| Day | Day | No | Testing day |
| Replicate | Replicate | No | Replicate number |
- Rows are grouped by exact concentration.
- Concentrations need exact assigned values.
- A result label the study does not list yet appears on Set up under Labels found in the data, with Add to categories and Add to nonreportable.
- Blank template (CSV) gives a matching empty file.
See Importing and mapping and Column reference.
The study still gives hit rates, but no C5, C50 or C95, in these cases, and a note on Results gives the reason:
- fewer than 3 concentrations with reportable results;
- every concentration all negative or all positive, or all-negative levels followed directly by all-positive ones with at most one mixed level between them (separation);
- hit rates that don't rise with concentration;
- a fit that doesn't converge.
Acceptance limits
Section titled “Acceptance limits”The dialog and its choices are in Set acceptance limits. For this study:
- A limit is a range for the C50 concentration, C5 concentration or C95 concentration.
- The limit is compared with the C5, C50 or C95 estimate itself. The Fieller confidence limits play no part in the decision.
- A limit is Undecided when the estimate couldn't be calculated, lies outside the tested concentrations or has open-ended Fieller limits, or when any included replicate is nonreportable. For a nonreportable replicate, the note under the table names the estimate, the number of nonreportable replicates and their concentrations, and whether the estimate meets its limit at face value. The FDA guidance, section 6, item 2 explains the bias from leaving such results out.
See About acceptance decisions.
Results and plots
Section titled “Results and plots”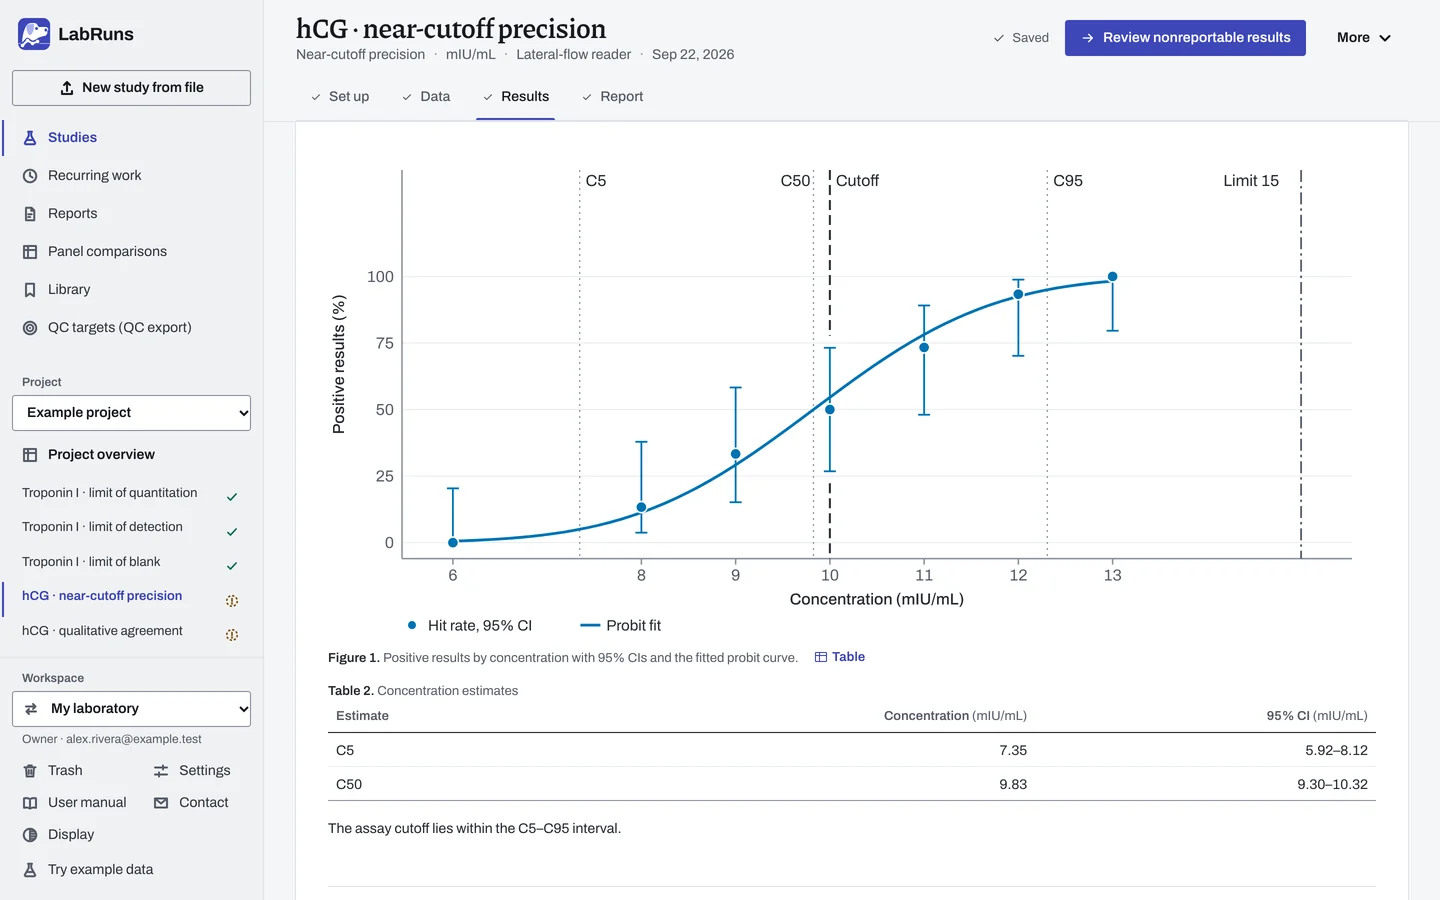
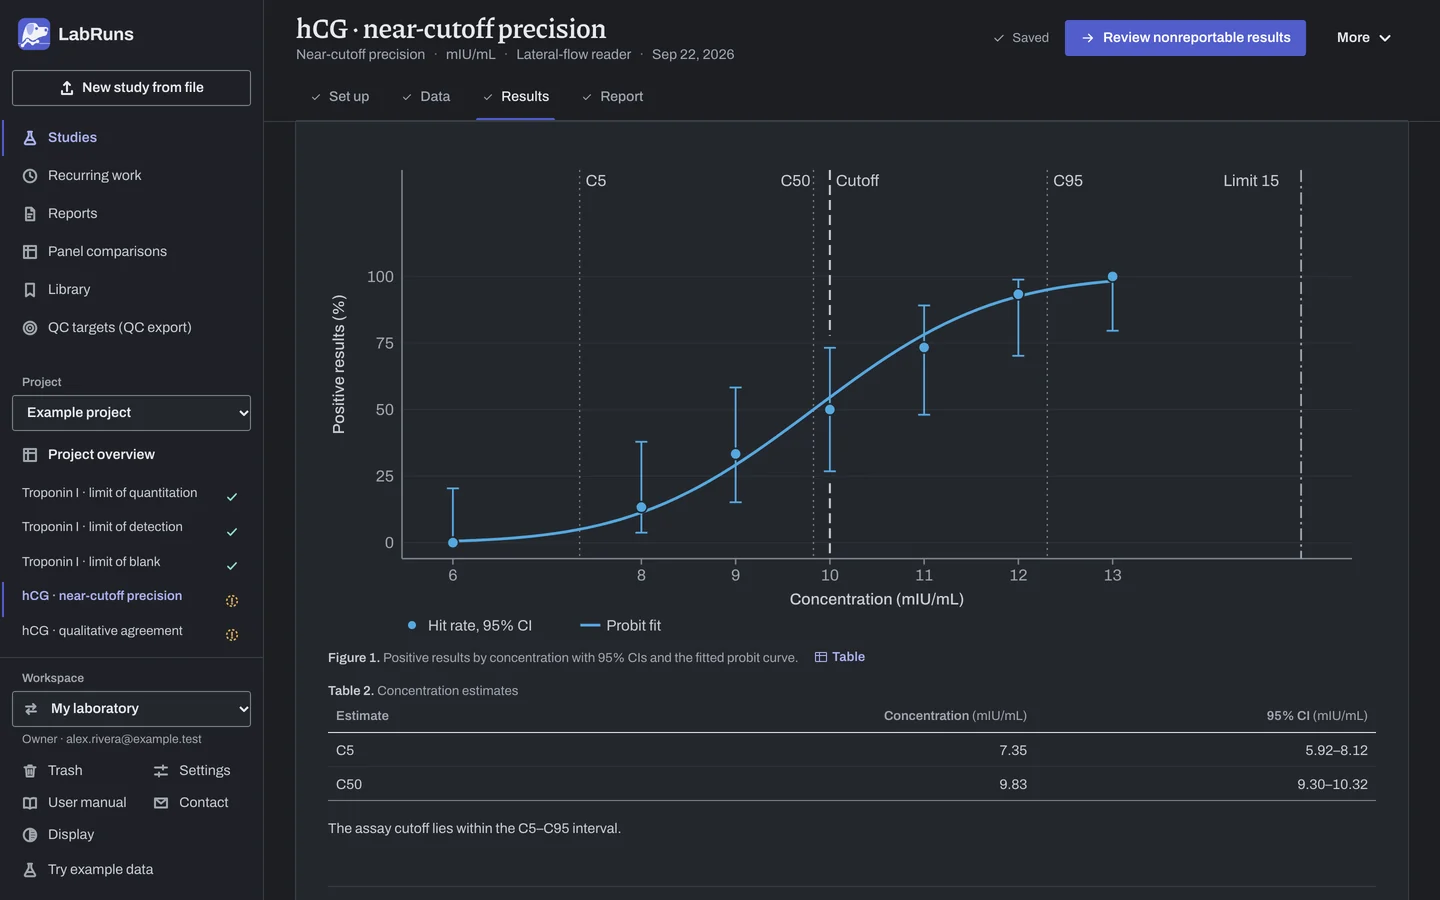
- The plot shows each concentration's positive results (%) with its Wilson interval and the fitted probit curve. Guides mark 5, 50 and 95 %, markers show C5, C50 and C95, and a line shows the cutoff when one is entered.
- Results by tested concentration gives the counts, hit rate and Wilson CI at each concentration. A concentration with only nonreportable results has no hit rate and is left out of the fit.
- C5 · C50 · C95: at C50 a result is equally likely to be positive or negative. A well-placed cutoff is usually near it. The Fieller limits are wider for C5 and C95, because the tails are less well determined.
- outside studied range marks an estimate beyond the tested concentrations.
- Unbounded Fieller limits mean the slope is too uncertain to bound that concentration.
- Probit fit diagnostics, under Supporting diagnostics: a Pearson chi-square much larger than its degrees of freedom suggests a poor fit. It is for information only.
Example
Section titled “Example”qualitative_cutoff.csv: 105 example urine hCG replicate results (mIU/mL), 15 per sample at 7 concentrations (6, 8, 9, 10, 11, 12 and 13). One replicate at 10 is equivocal.
Setup: default categories and nonreportable labels, Positive category positive, Linear concentration, Assay cutoff (optional) 10, 95 %. One acceptance limit: highest acceptable C95 concentration 15 mIU/mL.
| Concentration | Reportable | Positive | Hit rate | 95 % Wilson CI |
|---|---|---|---|---|
| 6 | 15 | 0 | 0.00% | 0.00–20.39% |
| 8 | 15 | 2 | 13.33% | 3.74–37.88% |
| 9 | 15 | 5 | 33.33% | 15.18–58.29% |
| 10 | 14 (1 equivocal) | 7 | 50.00% | 26.80–73.20% |
| 11 | 15 | 11 | 73.33% | 48.05–89.10% |
| 12 | 15 | 14 | 93.33% | 70.18–98.81% |
| 13 | 15 | 15 | 100.00% | 79.61–100.00% |
| Estimate | Concentration | 95 % Fieller limits |
|---|---|---|
| C5 | 7.35 mIU/mL | 5.92 to 8.12 mIU/mL |
| C50 | 9.83 mIU/mL | 9.30 to 10.32 mIU/mL |
| C95 | 12.31 mIU/mL | 11.58 to 13.62 mIU/mL |
- Probit fit diagnostics: Probit intercept a −6.5150, Probit slope b 0.6630, Pearson chi-square (df) 0.880 (5).
- The assay cutoff, 10 mIU/mL, lies within the C5–C95 interval.
- Counts: 7 concentrations, 104 reportable results, 1 nonreportable, 7 samples.
- For the C95 limit (≤ 15 mIU/mL), the acceptance table shows the estimate as 12.31 mIU/mL, but the outcome is Undecided because one replicate was nonreportable. The study is Undecided.
On log10 concentration (values above 0) the same file gives C5 7.55 (6.44 to 8.20), C50 9.72 (9.19 to 10.22) and C95 12.53 (11.65 to 14.32) mIU/mL, Pearson chi-square 1.314 (df 5).
Calculations and sources
Section titled “Calculations and sources”When you calculate hCG · near-cutoff precision in the example project, LabRuns records these methods:
- Each replicate result at a concentration counts once. Distinct samples are counted separately.
- For each concentration: reportable replicates, positives, hit rate and a two-sided 95% Wilson score interval. Nonreportable replicates are counted but left out of the denominator.
- Nonreportable replicates make the acceptance criteria indeterminate, because leaving them out can bias the estimates (FDA 2007 section 6, item 2).
- Probit model P(positive) = Φ(a + b·x), x = concentration, fitted by maximum likelihood on the grouped counts. Newton–Raphson with x centered, started from least squares on empirical probits (0/1 proportions clipped to 0.5/n and 1 − 0.5/n), with step-halving when the log-likelihood falls. It stops when every parameter change is below 1e−10, after at most 100 iterations. Covariance is the inverse observed information at the MLE.
- C_p = (Φ⁻¹(p) − a)/b for p = 0.05, 0.50 and 0.95. 95% Fieller limits solve (a − z_p + b·x)² ≤ z²(Vaa + 2x·Vab + x²·Vbb), with z = Φ⁻¹((1 + c)/2). These are the standard probit inverse confidence limits of Fieller (1954), with z set by the chosen confidence level. Limits are reported when b² − z²Vbb > 0 and the discriminant is positive. The Pearson chi-square with m − 2 df describes the fit.
- Estimates need at least 3 concentrations with reportable results, some mixed results and a rising hit rate. A criterion on a C_p outside the tested concentrations is indeterminate.
- Criteria evaluate unrounded estimates.
- With concentrations on the log10 scale,
xislog10concentration and eachC_pis back-transformed as10^x. - The Fieller limits use no heterogeneity scaling.
Study-design reference: FDA guidance. See Study reference.
Evidence references: CAP COM.40350, CHM.13750 (9 December 2025). In a binder, the CAP evidence index lists the report sections behind each requirement and the laboratory records that go with them.