


Proficiency and peer-QC tracking reference
A proficiency and peer-QC tracking study keeps a history of survey or monthly QC results for one analyte and instrument, grouped by concentration level. It calculates bias, percentage bias and SDI against the selected group, while retaining both peer-group and all-method summaries. Local acceptance and the provider's grade remain separate.
Settings
Section titled “Settings”| Setting | Choices and meaning |
|---|---|
| Results to track | Proficiency surveys or Monthly peer-QC summaries |
| Comparison group | Peer group or All methods: the group whose mean the bias is calculated against |
| Absolute bias allowance | Optional, in the study unit |
| Percentage bias allowance | Optional, a percentage of the selected group mean |
One study holds one analyte, instrument and unit.
Columns
Section titled “Columns”| Column | Required? | What to enter |
|---|---|---|
| Survey / month | Yes | The survey event or month |
| Date | No | A blank date is filled from the study date when saved |
| Material ID | Yes | The survey or QC material |
| Level | No | The concentration level |
| Laboratory result | Yes | The laboratory's result. A monthly QC row holds the laboratory's monthly mean for that material; a provider's reported laboratory mean can be entered |
| Peer mean, Peer SD | Mean when Comparison group is Peer group | The peer group's mean and SD. Leave an unavailable SD blank |
| All-method mean, All-method SD | Mean when Comparison group is All methods | The all-method mean and SD. Leave an unavailable SD blank |
| Provider grade | No | Exactly as supplied |
The selected group's SD is used to calculate a standard-deviation index. The other group's mean and SD are optional.
Acceptance limits
Section titled “Acceptance limits”- Without an allowance, the history is descriptive.
- Every included event must meet a selected local allowance. Equality meets the allowance.
- If both allowances are entered, the larger allowance applies.
- A percentage allowance requires a positive group mean.
- The provider grade is kept as entered and is not part of the local decision.
Results and plots
Section titled “Results and plots”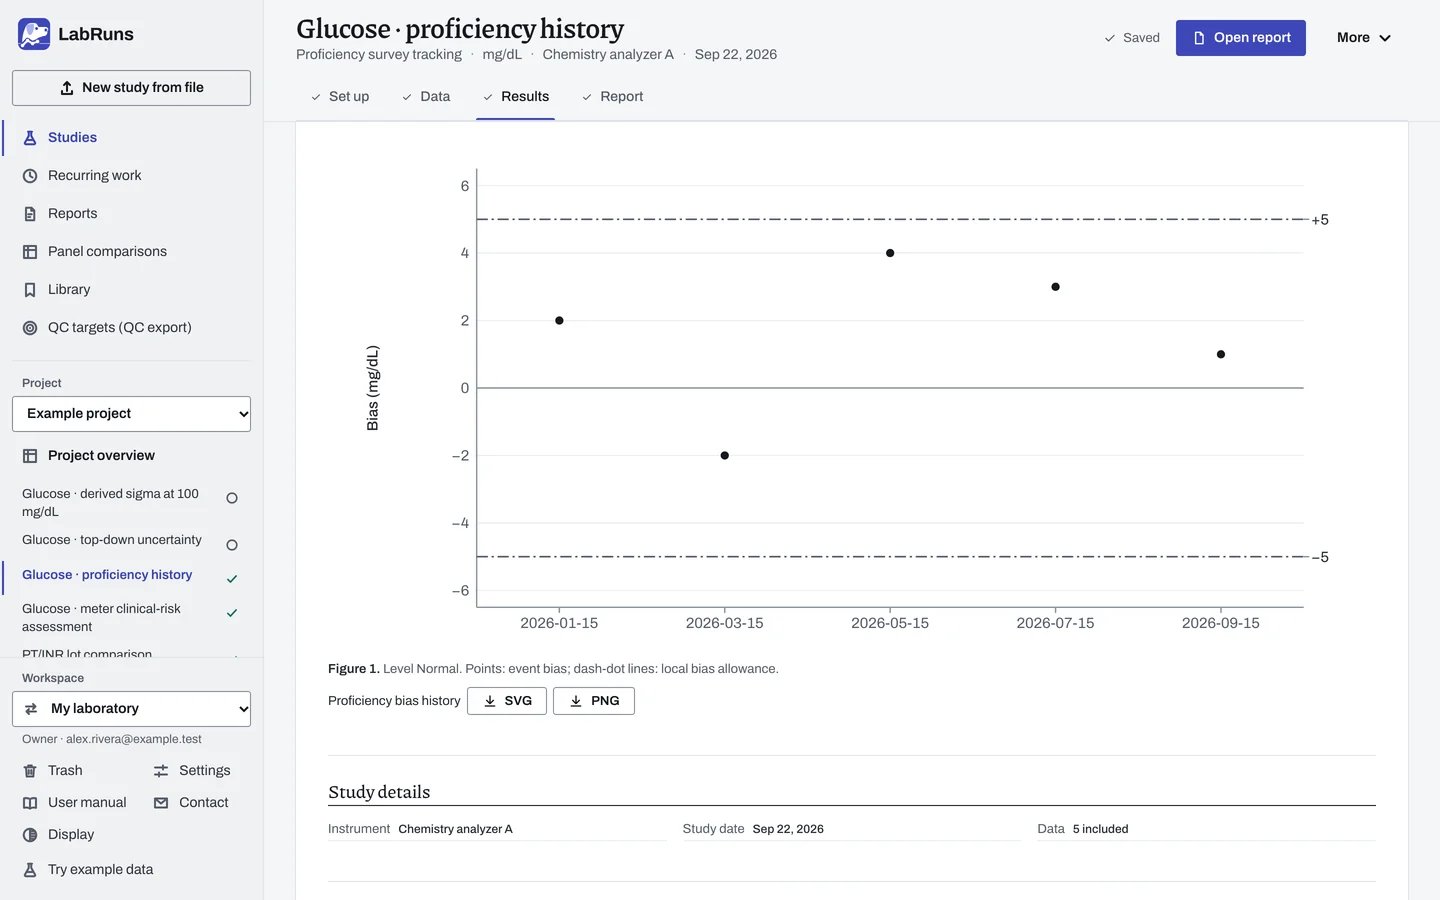
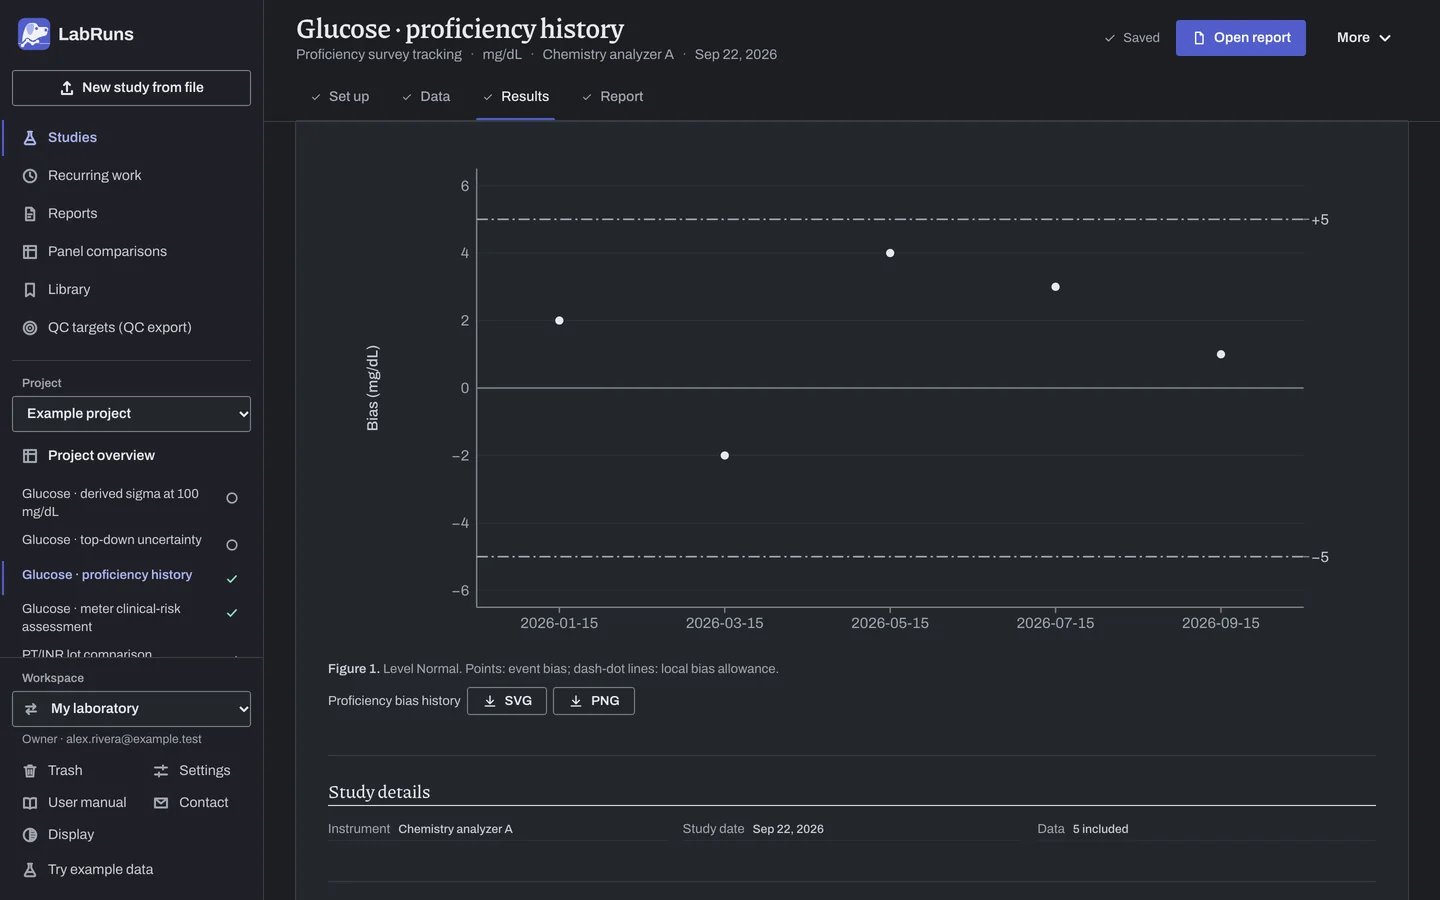
Results give the selected group and the used and total counts; excluded rows remain in total counts. Each event shows its result, group mean, bias and local decision alongside the history. An absent or zero group SD leaves SDI undefined and does not remove the bias calculation. A provider grade can differ from local acceptance because it uses the provider's assessment.
Example
Section titled “Example”The proficiency example tracks five survey results against a peer mean of 100 mg/dL. Laboratory results 102, 98, 104, 103 and 101 give biases of 2.0, −2.0, 4.0, 3.0 and 1.0 mg/dL. All meet the selected 5% local allowance. The third event has no peer SD: its 4.0% bias is retained, while SDI uses four of the five events.
Calculations and sources
Section titled “Calculations and sources”When you calculate Glucose · proficiency history in the example project, LabRuns records these methods:
- Bias = laboratory result − selected group mean. Percentage bias = 100 × bias / group mean and is undefined at a zero mean.
- SDI = bias / selected group SD. A blank or zero group SD leaves SDI undefined and does not remove the bias result. This SDI is a descriptive standardization using the entered group SD.
- Peer-group and all-method summaries remain separate. Provider grades are reported as entered, separately from the local calculation.
- Each survey or monthly summary is evaluated against the laboratory’s selected absolute or percentage bias allowance. If both are selected, the larger allowance applies. Equality meets the allowance. A percentage allowance requires a positive group mean.
- Every included event result with a selected allowance must meet it. With no local allowance, the result is descriptive. Excluded events stay in total counts and do not enter calculations.
The difference and standardized-deviation calculations follow the definitions discussed in Eurachem's proficiency testing guide, third edition, sections 7.2.4–7.2.5. Independent calculation evidence checks signed bias, missing SD, selected group separation and an inclusive local limit. See Calculation checks.