


Glucose meter error grids reference
Clarke and Parkes grids assign each included pair of meter and laboratory glucose results to a clinical-risk zone from A through E, with a separate summary for each meter. The result also summarizes signed percentage differences and the 95th percentile of absolute differences.
Settings
Section titled “Settings”| Setting | Meaning |
|---|---|
| Unit | mg/dL or mmol/L, for both result columns |
| Error grid | Parkes consensus or Clarke. Clarke uses one grid |
| Diabetes type | Parkes only: Type 1 or Type 2 |
| Minimum in zone A (%), Minimum in zones A + B (%), Maximum in zones D + E (%) | Optional laboratory criteria under Laboratory zone criteria. See Acceptance limits |
Columns
Section titled “Columns”| Grid column | Required? | What to enter |
|---|---|---|
| Specimen ID | Yes | Coded specimen ID. A pair without one is numbered S1, S2… when the study is saved |
| Laboratory glucose | Yes | The laboratory result, in the study unit |
| Meter glucose | Yes | The meter result for the same specimen and sampling occasion, in the study unit |
| Meter | No | Identifies the device when several meters are included |
| Replicate | No | Replicate label |
Each replicate pair has its own row and keeps the same specimen ID. Replicates count as separate pairs; the independent specimen count is shown separately.
Both values must fall within the published grid domain: 0–400 mg/dL for Clarke and 0–550 mg/dL for Parkes, or the equivalent in mmol/L. Data marks every included entry outside this domain. Correct the entries or choose Review exclusions to review the affected pairs and their exclusion reason together, then save and calculate the included pairs; excluded values and reasons stay in the report.
Acceptance limits
Section titled “Acceptance limits”The optional laboratory criteria are Minimum in zone A (%), Minimum in zones A + B (%) and Maximum in zones D + E (%). Equality meets a selected limit. With all three blank, the result reports the clinical-risk findings without an acceptance verdict.
Results and plots
Section titled “Results and plots”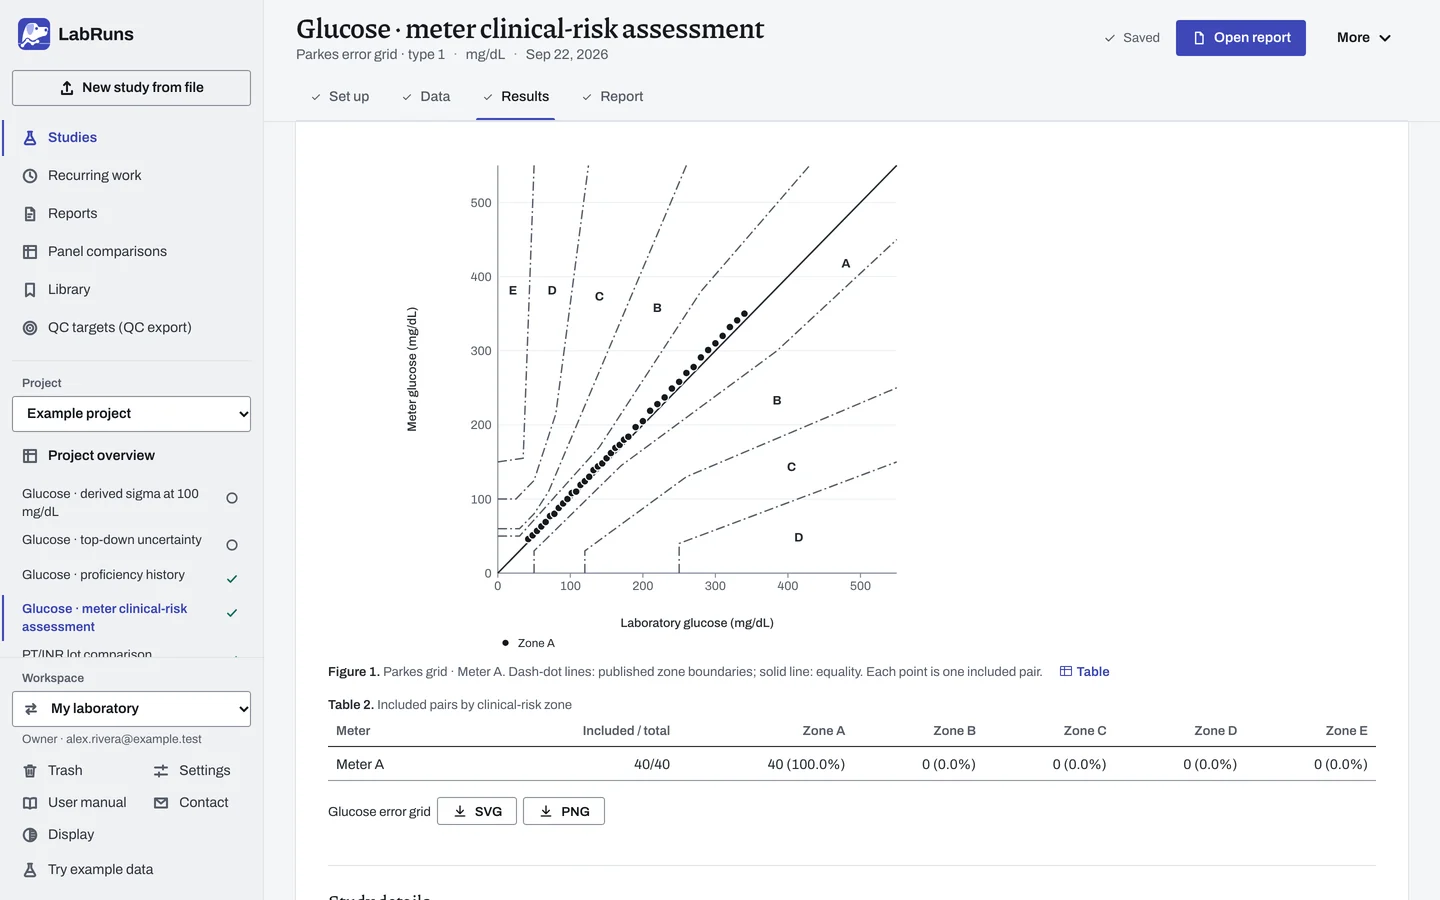
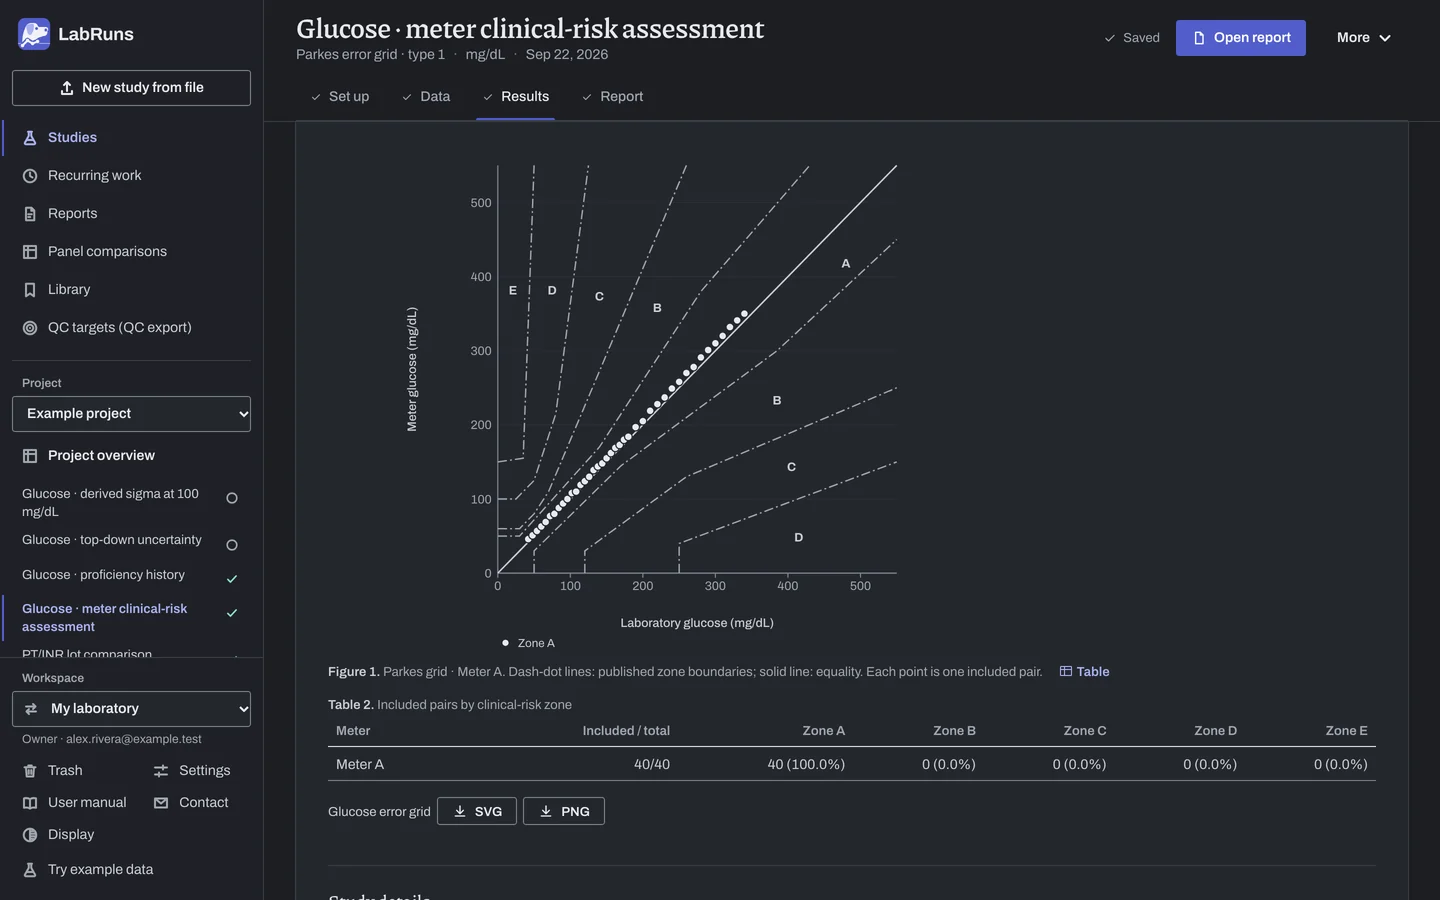
The plot draws the grid's zone boundaries with each zone's letter, and marks each included pair by its zone; the legend names the marks it uses: Zone A, Zone B and Zones C–E. Included pairs by clinical-risk zone gives included and total pairs and all five zone counts and percentages for each meter, alongside any selected laboratory criteria. Differences from laboratory glucose gives each meter's signed mean percentage difference, its usable pairs, the 95th percentile absolute difference and the independent specimen count.
A positive signed percentage difference means the meter reads higher on average. Its usable count omits pairs with zero laboratory glucose. Such pairs remain in the grid and absolute-difference summary. The 95th percentile absolute difference stays in the entered unit.
Example
Section titled “Example”The glucose-pair example contains 40 independent specimens measured by Meter A. The Parkes type 1 grid places all 40 in zone A. Mean signed percentage difference is 4.0%, using all 40 pairs. The nearest-rank 95th percentile absolute difference is 11.0 mg/dL. A selected minimum of 95% in A + B is met.
Calculations and sources
Section titled “Calculations and sources”When you calculate Glucose · meter clinical-risk assessment in the example project, LabRuns records these methods:
- Each included pair is placed in the selected clinical-risk grid; replicates are separate pairs. Independent specimen counts are also reported.
- Clarke uses the 0–400 mg/dL domain, inclusive 20% Zone A boundaries and both results below 70 mg/dL in Zone A. Other shared boundaries use E, C, D, then B priority. Its upper A boundary is meter = 70 mg/dL for reference values up to 175/3 mg/dL, then meter = 1.2 × reference.
- Parkes uses the published Table 1 type-specific coordinates within 0–550 mg/dL. A point exactly on a shared boundary is assigned to the lower-risk zone.
- For placement, mmol/L is divided exactly by 0.0555 to obtain mg/dL, using the NIDDK conversion. Entered units are retained in differences and result tables.
- Signed percentage difference = 100 × (meter − reference) / reference; zero-reference pairs are omitted only from this summary. The 95th percentile of absolute differences is the ordered value at rank ceiling(0.95 × included pairs).
- Only the laboratory’s selected zone percentage limits determine acceptance. Equality meets the selected limit. Risk zones do not impose an automatic acceptance rule.
The saved plot and zone classification use the same coordinates. The application defines how a result on a shared boundary is assigned to a zone.
Sources: the Clarke grid, the Parkes grid technical definition and the NIDDK glucose conversion.
Calculation evidence checks published coordinate knots, representative zone assignments, the Clarke 20% boundary, unit conversion and independently counted summaries. See Calculation checks.
Evidence references: CAP COM.40300, COM.40350 (9 December 2025). In a binder, the CAP evidence index lists the report sections behind each requirement and the laboratory records that go with them.