


Qualitative agreement reference
Qualitative agreement compares the category, such as positive or negative, or a grade such as 1+, that a test method and a comparative method give on each specimen. It reports the agreement table, the agreement percentages with Wilson intervals, kappa and the disagreements. The study has no unit.
Settings
Section titled “Settings”All on Set up under Qualitative performance, except the confidence level. Study mode is already Categorical agreement (test vs comparative).
| Setting | Default | Meaning |
|---|---|---|
| Result categories · declared order | negative, positive |
While they are still the default and your results use other labels, such as Not detected and Detected, the categories are taken from your results when you import, save or calculate. Two categories give a 2×2 table with PPA and NPA. Three or more give a larger table, listed lowest first when ordered |
| Positive category | Chosen from the labels | One of the declared categories, used for two-category tables. The report's study details print it under Positive category |
| Nonreportable labels | equivocal, invalid, indeterminate |
These results stay in the tables but leave the reportable block |
| Comparative method type | Non-reference comparative method · percent agreement | See Comparative method type |
| Population prevalence (%) | Blank | Shown with Reference standard and two categories. See Predictive values against a reference standard |
| Category order | Unordered (nominal) | Ordered (semiquantitative) adds adjacent agreement and Weighted kappa |
| Weighted kappa | None | With ordered categories: None, Linear agreement weights or Quadratic agreement weights |
| Confidence level | 95 % | Under Calculation settings: 90 %, 95 % or 99 %. Sets the Wilson and kappa intervals |
With two categories, the Positive category is chosen from the labels themselves, whatever order the rows are in: + beside -, 1 beside 0, Present beside Absent, Detected beside Not detected, Reactive beside Nonreactive, or any label containing positive. Labels the software cannot read either way (such as A and B) take the second as positive.
Comparative method type
Section titled “Comparative method type”What the percentages mean depends on the comparative method type:
- Non-reference comparative method · percent agreement (default): positive percent agreement (PPA), negative percent agreement (NPA) and overall percent agreement. They describe agreement with that method only. See PPA and NPA.
- Reference standard · sensitivity/specificity: for a true reference standard. The same formulas are then labeled Sensitivity and Specificity. See sensitivity and specificity and the FDA guidance.
Columns
Section titled “Columns”| Column use | Grid column | Required | What to enter |
|---|---|---|---|
| Specimen or material ID | Specimen ID | Yes | Coded specimen ID, one per specimen |
| Comparative method result | Comparative method result | Yes | A declared category or nonreportable label |
| Test method result | Test method result | Yes | A declared category or nonreportable label |
| Replicate | Replicate | No | Not used. The first included row for each specimen is analyzed, in entry order, and later rows are repeats |
- Labels ignore case and surrounding spaces.
- Any other value, such as
<0.5, appears on Set up under Labels found in the data, with Add to categories and Add to nonreportable. Add to categories replaces a startingnegativeorpositivecategory that no result uses. - Blank template (CSV) downloads the empty column template.
See Qualitative results that are not reportable, Importing and mapping and Column reference.
Acceptance limits
Section titled “Acceptance limits”The dialog and its choices are in Set acceptance limits. For this study:
- With two categories, choosing Overall agreement or its lower confidence bound shows a reminder to review positive and negative agreement separately, or sensitivity and specificity against a reference standard. High overall agreement can hide a low value in one category (FDA guidance, section 4.1).
- Agreement percentages use reportable pairs. A nonreportable test result makes overall agreement and agreement in that specimen's comparator category Undecided. A nonreportable comparator result makes overall, positive and negative agreement Undecided. Limits on a lower confidence bound follow the same rules. The FDA guidance, section 6, item 2 explains why.
- Positive and negative limits are Not applicable to tables with more than two categories.
- Kappa, McNemar and the paired difference are for information.
See About acceptance decisions.
Results and plots
Section titled “Results and plots”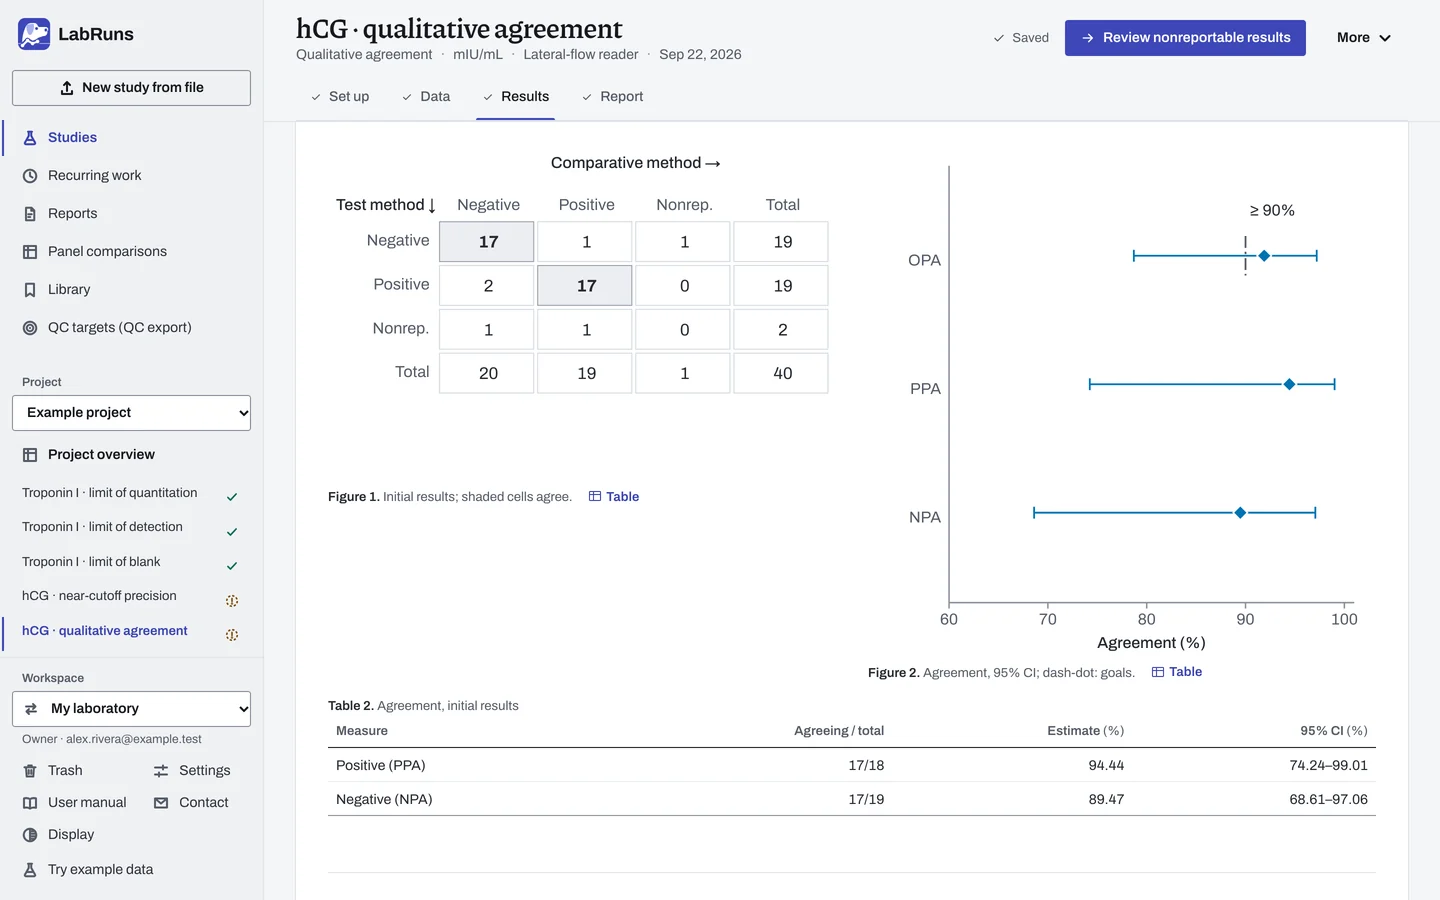
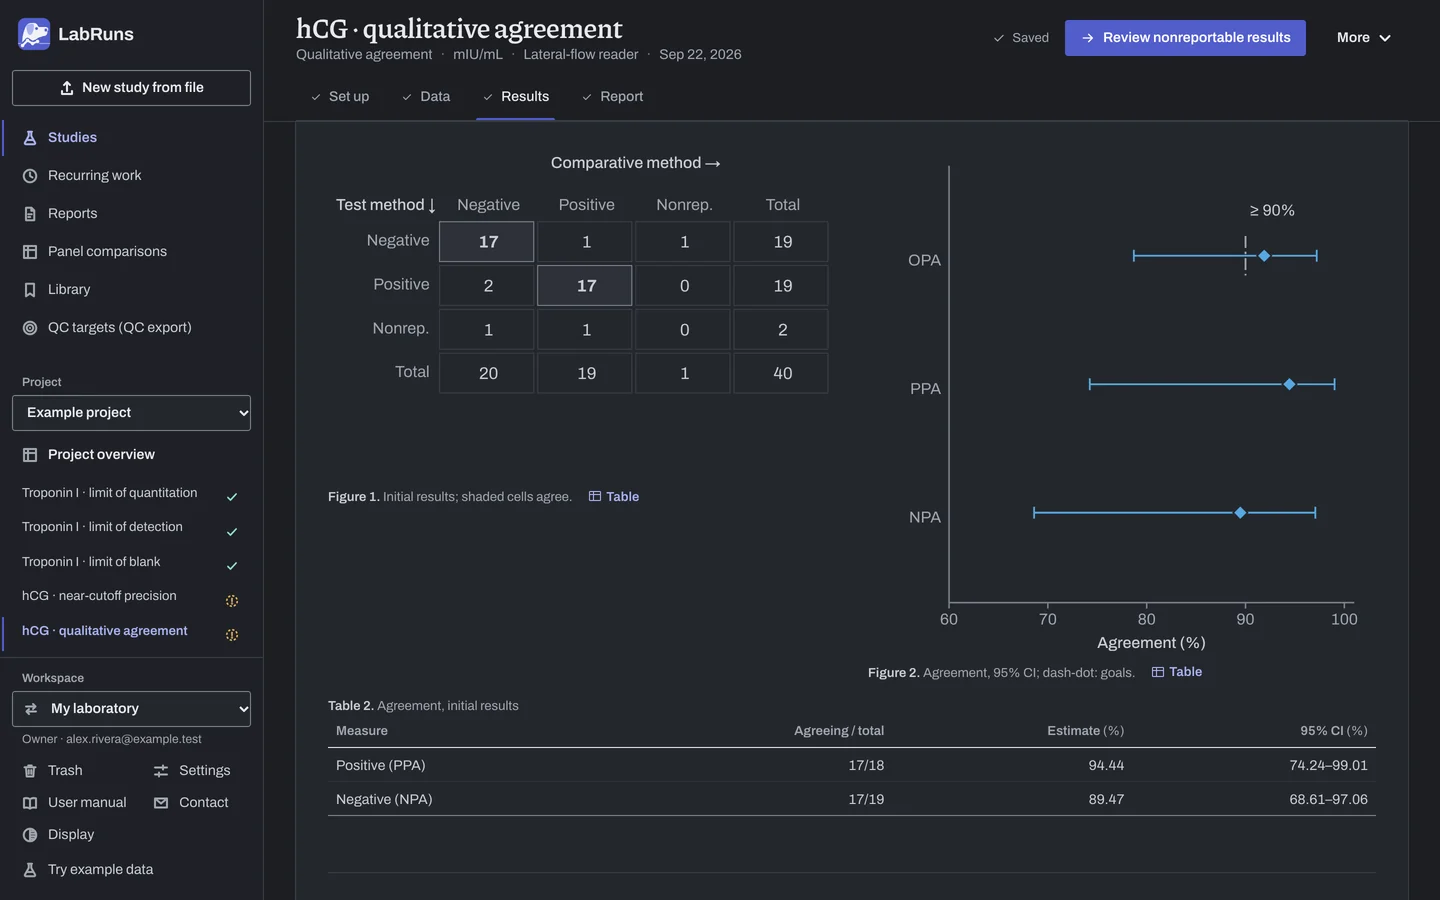
- Contingency table: counts each specimen by its first result. Percentages come from the reportable block. The Nonreportable row and column hold the rest.
- Two overall figures: Overall percent agreement uses reportable pairs. All-pairs agreement counts nonreportable specimens as disagreement. A large gap means nonreportable results matter.
- PPA and NPA (two categories only): small denominators give wide intervals.
- Kappa: agreement beyond chance, on a scale from −1 to 1. Its large-sample CI is bounded at −1 and 1 and can be imprecise in small tables. With perfect agreement there is no SE or CI. Weighted kappa weights disagreements by category distance. Quadratic weights penalize one-grade differences less.
- McNemar exact p (two categories): tests whether the disagreements lean one way, b against c.
- Positive-proportion difference (two categories): a positive value means the test calls more positives.
- Discordant and nonreportable pairs lists each disagreement and nonreportable pair. With ordered categories it has a Distance column, the test grade minus the comparative grade.
- Repeat results lists later rows for the same specimen and whether they differ from the first. They are not counted.
Predictive values against a reference standard
Section titled “Predictive values against a reference standard”A two-category study with Reference standard selected also gives positive predictive value (PPV) and negative predictive value (NPV), using reportable initial results. With Population prevalence (%) blank, these are observed PPV = true positives / all candidate positives and NPV = true negatives / all candidate negatives, with Wilson intervals. They reflect the prevalence in the collected panel.
With a prevalence entered, PPV and NPV are modeled from the observed sensitivity and specificity and labeled Modeled with the entered prevalence. The prevalence is treated as fixed, and sensitivity and specificity must apply to that population. Conservative intervals propagate both estimates using simultaneous exact binomial intervals; they do not include uncertainty in the entered prevalence. Predictive values describe the study and do not alter the agreement criteria.
Resolved results (retest or adjudication)
Section titled “Resolved results (retest or adjudication)”Each specimen can have one resolved result, from a retest or from adjudication by a third method. It never changes the main table or the acceptance limits, which use first results. Resolved results (secondary) shows the tables recalculated with them and marks each entry as applied or not applied, with a reason. In Results and the report they follow the supporting statistics. Page 1 always shows the initial results.
Resolving only discordant or nonreportable specimens can bias the secondary table, and a warning says so (discrepant resolution, FDA 2007 guidance). The warning clears once at least one concordant specimen is resolved, but that alone does not establish an unbiased sampling plan.
Example
Section titled “Example”Download qualitative_agreement.csv: 42 example urine hCG rows for 40 specimens. Two specimens have a repeat row at the end. Three first results are nonreportable: Q015 (test equivocal), Q026 (comparative equivocal) and Q035 (test invalid).
Setup: default categories and labels, Positive category positive, Non-reference comparative method · percent agreement, 95 %. Acceptance limits: overall agreement at least 90 %, and positive agreement lower confidence bound at least 80 %.
| Test ↓ / comparative → | negative | positive | Nonreportable | Total |
|---|---|---|---|---|
| negative | 17 (d) | 1 (c) | 1 | 19 |
| positive | 2 (b) | 17 (a) | 0 | 19 |
| Nonreportable | 1 | 1 | 0 | 2 |
| Total | 20 | 19 | 1 | 40 |
| Agreement | Count and percent | 95 % Wilson CI |
|---|---|---|
| Overall percent agreement | 34/37 = 91.89% | 78.70–97.20% |
| Positive percent agreement (PPA) | 17/18 = 94.44% | 74.24–99.01% |
| Negative percent agreement (NPA) | 17/19 = 89.47% | 68.61–97.06% |
| All-pairs agreement (nonreportable counted as non-agreement) | 34/40 = 85.00% | 70.93–92.94% |
| Supplement | Value |
|---|---|
| Cohen kappa (unweighted) | 0.838, SE 0.090, 95 % normal CI 0.662 to 1.000 |
| McNemar exact p (b = 2, c = 1) | 1.000 |
| Positive-proportion difference (test − comparative) | 2.70 percentage points, 95 % paired CI −7.43 to 12.67, reportable pairs (n = 37) |
| Limit name | Limit | Observed | Outcome |
|---|---|---|---|
| Overall agreement | ≥ 90% | 91.89% among reportable pairs | Undecided. Three specimens have a nonreportable first result. |
| Positive agreement / sensitivity, lower bound (%) | ≥ 80% | 74.24% among reportable pairs | Undecided. Q015 (comparative positive, test equivocal) and Q026 (comparative equivocal) affect it. |
The study is Undecided.
The kappa CI's upper limit, 1.000, is where the interval stops at 1. The discordant list shows Q011 (test negative / comparative positive), Q022 and Q030 (test positive / comparative negative) and the three nonreportable pairs. Q015's repeat reads positive, but the analysis uses its first result, equivocal.
With Reference standard · sensitivity/specificity, the numbers are the same and the rows read Sensitivity (17/18 = 94.44%) and Specificity (17/19 = 89.47%).
A resolved result
Section titled “A resolved result”Retest Q011 as positive on both methods. The main table stays a/b/c/d 17/2/1/17. The secondary is 18/2/0/17, with overall agreement 35/37 = 94.59% (95 % Wilson CI 82.30–98.50%), PPA 18/18 = 100.00% (82.41–100.00%), NPA unchanged at 17/19 = 89.47%, and all-pairs agreement 35/40 = 87.50% (73.89–94.54%). The discrepant-resolution warning appears.
Ordered categories and weighted kappa
Section titled “Ordered categories and weighted kappa”Download qualitative_ordinal.csv: 30 example urine protein grades negative, 1+, 2+, 3+. Setup: Ordered (semiquantitative), Linear agreement weights, acceptance limits overall agreement at least 80 % and positive agreement at least 90 %.
| Result | Saved value |
|---|---|
| Exact (overall) agreement | 23/30 = 76.67% (95 % Wilson CI 59.07–88.21%) |
| Adjacent-category agreement (|i − j| ≤ 1) | 30/30 = 100.00% (88.65–100.00%) |
| Cohen kappa (unweighted) | 0.685, SE 0.104, 95 % normal CI 0.482 to 0.888 |
| Linear weighted kappa | 0.805, SE 0.068, 95 % normal CI 0.671 to 0.939 |
| Overall agreement (limit ≥ 80%) | Not met (76.67%) |
| Positive agreement / sensitivity (%) (limit ≥ 90%) | Not applicable. The table has 4 categories. |
The study status is Criteria not met.
With Quadratic agreement weights, weighted kappa is 0.899 (95 % CI 0.823 to 0.975). Every disagreement here is one grade apart, so adjacent agreement is 100 %.
Calculations and sources
Section titled “Calculations and sources”When you calculate hCG · qualitative agreement in the example project, LabRuns records these methods:
- Each specimen’s result is its first included row in entry order. Later rows are repeats. They are summarized but not counted in n.
- Labels match the declared categories and nonreportable labels, ignoring case and surrounding spaces. A specimen with a nonreportable initial result leaves the reportable k×k table, appears in the Nonreportable row or column, and counts as non-agreement in all-pairs agreement.
- Reportable-only proportions describe the specimens with usable results. A nonreportable initial result makes the affected agreement criteria indeterminate (FDA 2007 section 6, item 2). A nonreportable comparator result affects positive, negative and overall agreement. A nonreportable candidate result affects its comparator stratum and overall agreement.
- Binary tables follow FDA guidance Table 4, with the candidate (new test) in rows and the comparator in columns. a = candidate+/comparator+, b = candidate+/comparator−, c = candidate−/comparator+, d = candidate−/comparator−. Positive agreement = a/(a+c), negative agreement = d/(b+d), overall = (a+d)/n.
- Two-sided 95% Wilson score intervals without continuity correction. Centre = (p + z²/2n)/(1 + z²/n), half-width = z·√(p(1−p)/n + z²/4n²)/(1 + z²/n), z = Φ⁻¹((1 + c)/2).
- Descriptive supplements: exact McNemar p = min(1, 2·BinomCDF(min(b, c); b + c, ½)) for binary tables, and Cohen kappa κ = (pₒ − pₑ)/(1 − pₑ). Ordered categories add exact and adjacent (|i − j| ≤ 1) agreement and, when selected, linear (1 − |i−j|/(k−1)) or quadratic (1 − (i−j)²/(k−1)²) weighted kappa.
- Kappa SE uses the Fleiss–Cohen–Everitt (1969) large-sample variance, Eq. 8 (Eq. 13 for identity weights). With cell fractions pᵢⱼ, row fractions rᵢ, column fractions cⱼ, agreement weights wᵢⱼ, pₒ = Σwᵢⱼpᵢⱼ, pₑ = Σwᵢⱼrᵢcⱼ, Aᵢ = Σⱼwᵢⱼcⱼ and Bⱼ = Σᵢwᵢⱼrᵢ, set Gᵢⱼ = [wᵢⱼ − (1−κ)(Aᵢ+Bⱼ)]/(1−pₑ). Var(κ) = Σpᵢⱼ(Gᵢⱼ−ΣpᵢⱼGᵢⱼ)²/n and SE = √Var. The two-sided 95% normal CI is κ ± Φ⁻¹((1+confidence)/2)·SE, cut off at −1 and 1. It is a large-sample approximation and can be unreliable in small or sparse tables.
- Paired positive-proportion difference = 100·(b−c)/n percentage points, candidate minus comparator, among reportable initial pairs. Two-sided 95% CI by Newcombe (1998) method 10. Take ordinary Wilson limits [L₁,U₁] and [L₂,U₂] for the candidate and comparator positive proportions p₁ and p₂. ρ = (ad−bc)/√[(a+b)(c+d)(a+c)(b+d)], with a positive numerator replaced by max(ad−bc−n/2, 0) and ρ = 0 for a zero denominator. The limits are Δ−√[(p₁−L₁)²+(U₂−p₂)²−2ρ(p₁−L₁)(U₂−p₂)] and Δ+√[(U₁−p₁)²+(p₂−L₂)²−2ρ(U₁−p₁)(p₂−L₂)], times 100.
- Criteria evaluate unrounded estimates.
- PPA (or sensitivity) is positive agreement and NPA (or specificity) negative agreement.
- Kappa has no SE with zero variance or fewer than 2 pairs.
- Resolved results: each applied entry replaces that specimen's first pair in a copy of the data, which is analyzed the same way without acceptance limits.
See Study reference.
Evidence references: CAP COM.40350, CHM.13750 (9 December 2025). In a binder, the CAP evidence index lists the report sections behind each requirement and the laboratory records that go with them.