


Linearity reference
A linearity study gives up to three separate results. A method can be linear and still biased.
- Linearity checks the level means against a straight line fitted through all of them.
- Accuracy checks each level mean against its assigned concentration, by bias or recovery, and each included replicate when Check every replicate against its assigned value is selected.
- Reportable range, with claimed reportable limits entered, checks that there are levels near each limit and that every level between them meets its limits.
Settings
Section titled “Settings”The design needs at least three different expected concentrations, each zero or higher, spread between the intended low and high ends. Two level names at one concentration count once toward those three. A level with one replicate has no SD or interval.
| Setting | Where | What it does |
|---|---|---|
| Calculate theoretical values | Linearity preparation | For kits made so that every level is the same step (delta) above the one before. Two levels are held true and the other levels' expected values are calculated from them, so no assigned concentrations are needed |
| First level held true, Second level held true | Linearity preparation, with Calculate theoretical values | The two kit levels whose measured means are kept as expected values. Left at Lowest level and Highest level, the lowest and highest measured kit levels are used |
| Check every replicate against its assigned value | Set up, without Calculate theoretical values | Compares each included replicate with a total-error allowance as well as checking the level mean |
| Total-error allowance (study unit), Total-error allowance (%) | With Check every replicate against its assigned value | The allowance at each assigned concentration. With both, the larger applies. A percentage allowance requires a ratio scale |
| Claimed lower reportable limit, Claimed upper reportable limit | Reportable range (optional) | Both together turn on the reportable range check |
| Proximity allowance (%), Proximity allowance in the study unit (optional) | Reportable range (optional) | How close a level must be to each limit. With both, the larger applies. Left blank, the allowance is 10% of each limit, filled in when the study is saved |
| Measurement scale | Calculation settings | Percent values need a ratio scale, the default |
| Permit negative results | Calculation settings | Needed for a result below zero, such as a blank reading slightly under 0 |
Calculate theoretical values derives concentrations from the same measured data, so Check every replicate against its assigned value is not used with it.
Columns
Section titled “Columns”One row per measured replicate.
| Column use | Grid column | Required | What to enter |
|---|---|---|---|
| Expected (assigned) value | Expected concentration | Yes, unless Calculate theoretical values is ticked | The prepared concentration in the study unit, zero or more |
| Result | Result | Yes | The measured value |
| Level or group | Level (Kit level with calculated theoretical values) | No; yes with Calculate theoretical values | A level name for the preparation. Blank groups rows by expected concentration. With calculated theoretical values, the kit level number (1, 2, 3 …); Level 3 and L3 also read as level 3 |
| Specimen or material ID | Specimen ID | No | A preparation or aliquot ID |
| Day, Run | not shown | No | Labels |
| Replicate | Replicate | No | The replicate number |
The calculation stops, with a message that marks the row or level, when:
- fewer than three different expected concentrations have results
- a level has two expected concentrations
- rows at one expected concentration name a level on some rows and leave Level blank on others
- an expected concentration is missing or negative
- a result is negative while Permit negative results is off
With Calculate theoretical values, it also stops when a level has no number, two levels share a number, the higher held-true level doesn't read higher than the lower one, or the steps would put a level below zero.
Acceptance limits
Section titled “Acceptance limits”- Deviation from the fitted line decides linearity. A percentage is taken of each level's fitted value, so every level has its own allowance.
- Bias from the expected concentration decides accuracy, as do Relative bias and Recovery under More statistics. A percentage is taken of each level's expected concentration.
- A level with only one replicate, or a value that can't be calculated, is Undecided, and so is the study unless another limit is not met.
- On an interval scale, Pass only when within both reads Not met if the bias or deviation exceeds the study-unit limit, and Undecided otherwise, regardless of which allowance is smaller.
- At a zero-concentration level, a percentage-only limit reads Undecided. A Pass only when within both limit reads Not met when the level is beyond its study-unit part, and Undecided otherwise. A study-unit limit, or Pass when within either (the larger allowance) with a study-unit part, can be decided. A recovery limit can't be decided at zero.
- With no limit set there is no pass or fail.
One unmet limit gives Criteria not met. See Set acceptance limits.
Every replicate
Section titled “Every replicate”With Check every replicate against its assigned value, each level needs at least two included readings to decide the criterion. With one reading, the individual error is shown and the level remains Undecided. Every included replicate must be within its allowance; a result exactly on the allowance passes. A level can have an acceptable mean while an individual result fails. The saved result lists the replicate errors and limits, and any failing replicate makes the accuracy conclusion fail.
Held-true levels
Section titled “Held-true levels”With Calculate theoretical values, bias and recovery are judged against the calculated expected values. At the two held-true levels bias is zero by design, so those levels read Not applicable for bias and recovery limits and are marked held true in the results and the report. Deviation from the fitted line is the same whichever levels are held true.
Reportable range
Section titled “Reportable range”The window at each claimed limit is the limit ± the proximity allowance. The range is checked in three steps:
- Each end is covered. Some level has an expected concentration within the window. At the lower end, a blank or minimal level from 0 up to the lower limit also covers it. The level closest to the limit is the covering level.
- Every level from the lower to the upper covering level meets its limits. Levels outside that span don't affect the range result.
- A deviation limit applies to those levels: Deviation from the fitted line under Acceptance limits.
The range is verified (Criteria met) when all three hold. It reads Criteria not met when an end has no covering level or a level in the span fails. It is Undecided when no deviation limit applies or a level in the span has no decision. The range result is part of the study result.
Example. Take LDH levels at 12, 253, 485, 707 and 921 U/L (from Xiao and Chambliss 2023) and a claimed range of 10 to 1000 U/L with a 10% allowance. The lower window is 9 to 11 U/L, and 12 U/L is outside it. The upper window is 900 to 1100 U/L, and 921 U/L is inside it. The lower end has no level, so the range isn't verified. A level at 10.5 U/L would cover it, and so would a blank at 0 U/L. With a claimed lower limit of 0 U/L, only a level at 0 U/L or inside its window covers that end.
Results and plots
Section titled “Results and plots”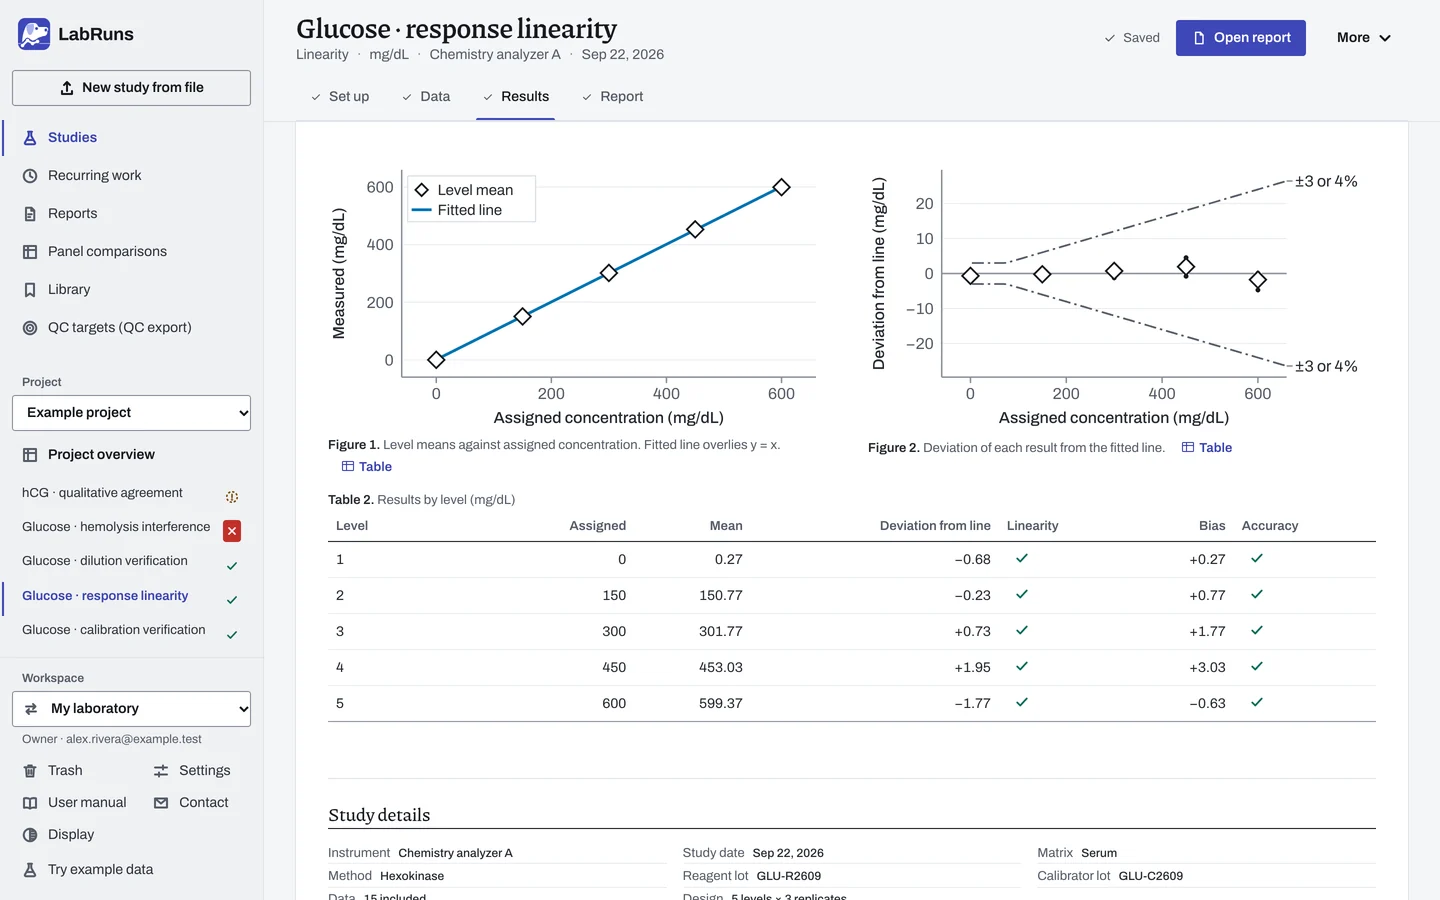
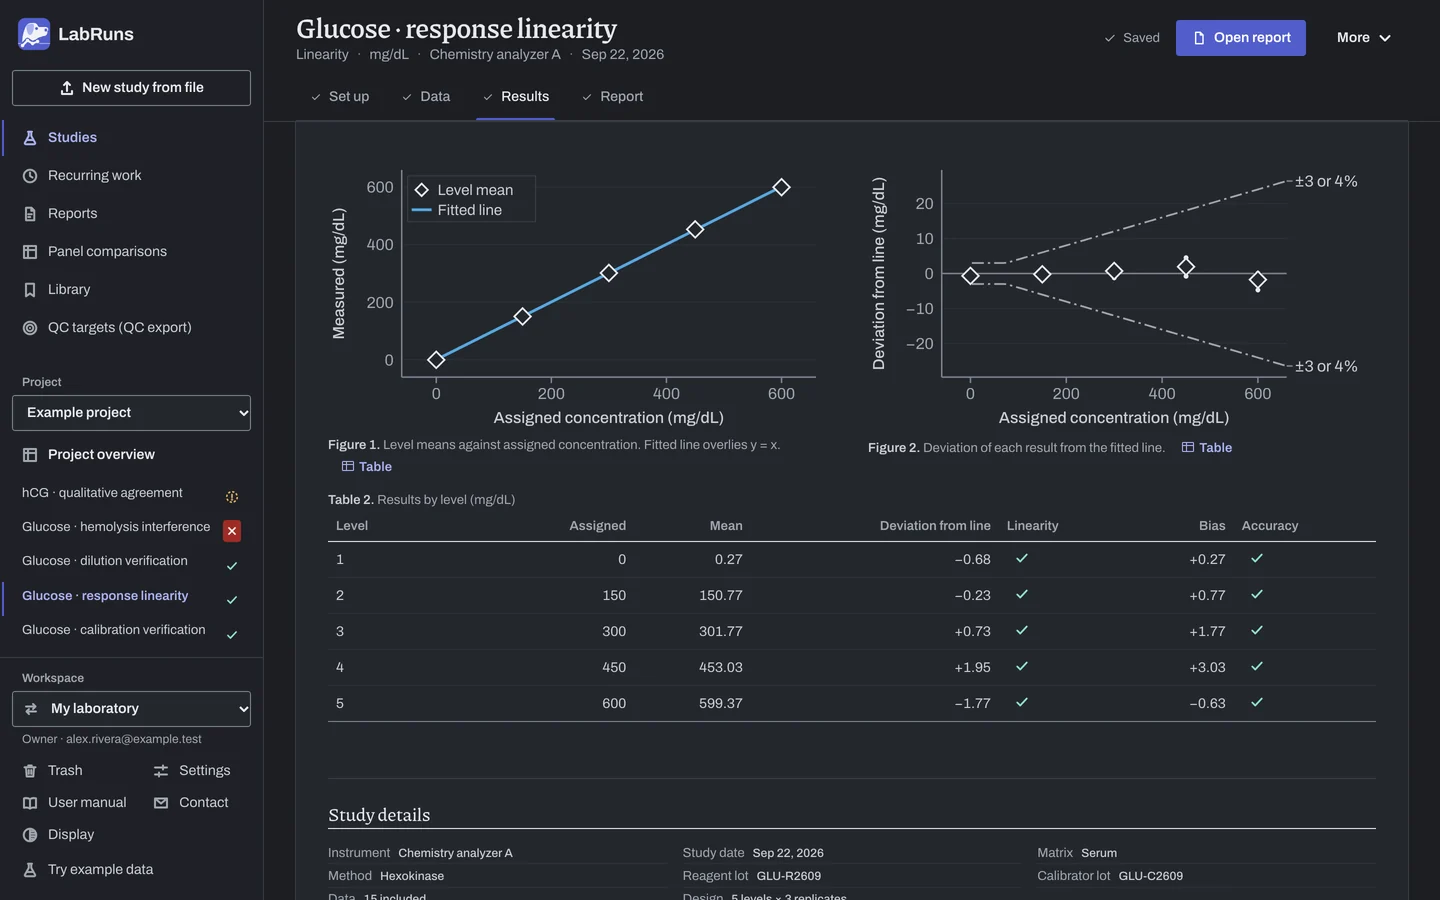
Results shows the same blocks as the report, described below, and adds Fit settings and evaluated range (weighting, origin handling and the evaluated interval) and a Percent recovery plot of each level mean against 100%. Detailed statistics → Level deviations and recovery lists, for every level, the expected value, mean, fitted value with its interval, deviation, relative deviation, bias and recovery.
The report puts the decision on page 1. At the top, the level means against the assigned concentrations sit beside each result's deviation from the fitted line, with the deviation limit drawn as dashed lines. Curvature or scatter growing with concentration shows here; a U-shape or steady trend in the deviations suggests curvature. Below them, Results by level gives each level's mean, its deviation from the line with its Linearity result, and its bias (or recovery, when that is the limit) with its Accuracy result. One line gives the fitted line's slope, intercept, residual SD and R-squared. Acceptance criteria then has one row per question (linearity, accuracy and reportable range), each with its limit, the deciding level and the result. All three questions stay visible; a question without a limit or claimed range reads Not evaluated. Page 2 starts with the data listing of every result. Level detail (replicates, SD, the fitted value with its interval, relative deviation and recovery) and, when a range was claimed, the Reportable range windows follow it.
- A note flags any gap between neighbouring levels wider than half the tested range: there are no results inside that gap.
- Levels with different names but the same expected concentration are fitted as separate points, and a note asks for confirmation that they are separate preparations.
Example
Section titled “Example”The example project's study Glucose · response linearity uses linearity.csv: five levels at expected 0, 150, 300, 450 and 600 mg/dL, three replicates each.
Setup: analyte Glucose, unit mg/dL, 95% confidence, claimed reportable range 2 to 600 mg/dL with the 10% end allowance. Two limits, all levels: Deviation from fit within 3 mg/dL or 4%, whichever is greater (segments 0,75,absolute,3 and 75,,relative,4), and Bias from expected within 6 mg/dL or 8%, whichever is greater (segments 0,75,absolute,6 and 75,,relative,8).
| Estimate | Displayed value |
|---|---|
| Slope | 1.000 (95% CI 0.989–1.011) |
| Intercept | +0.947 mg/dL (95% CI −3.07 to 4.96) |
| Residual SD about the fit | 1.63 mg/dL |
| R-squared | > 0.9999 |
| Evaluated interval | 0–600 mg/dL |
| Level | Expected | Mean | Deviation from fit | Bias | Recovery |
|---|---|---|---|---|---|
| 1 | 0 | 0.27 | −0.68 | +0.27 | Can't be calculated (expected 0) |
| 2 | 150 | 150.77 | −0.23 | +0.77 | 100.51% |
| 3 | 300 | 301.77 | +0.73 | +1.77 | 100.59% |
| 4 | 450 | 453.03 | +1.95 | +3.03 | 100.67% |
| 5 | 600 | 599.37 | −1.77 | −0.63 | 99.89% |
All five levels meet the deviation and bias limits. Level 1 (0 mg/dL) covers the lower end of the claimed range and level 5 (600 mg/dL) is within 10% of the upper end, so linearity, accuracy and the reportable range are all Met and the study status is Criteria met.
A second study replaced the bias limit with a recovery limit of 95 to 105 % for all levels. Levels 2 to 5 meet it. Recovery can't be calculated at level 1 (expected 0), so accuracy and the reportable range are Undecided and so is the study.
Calculations and sources
Section titled “Calculations and sources”When you calculate Glucose · response linearity in the example project, LabRuns records these methods:
- Unweighted least-squares line of level means against expected concentration, one point per level. At least 3 different expected concentrations are needed.
- Deviation = level mean − fitted response. Relative deviation divides by |fitted response|.
- Bias = level mean − expected concentration.
- R-squared is for information only. Confidence intervals are 95% Student t.
- The tested range runs from the lowest to the highest included expected concentration.
- Reportable range: each end needs a level within 10% of the limit, a level from zero up to the lower limit also covers the lower end, and every level between them must meet its criteria.
- Fit: slope = Sxy/Sxx, intercept = ȳ − slope·x̄.
- Relative deviation % = 100 × deviation / |fitted|. It needs a nonzero expected concentration, a fitted value clearly away from zero and a ratio scale.
- Relative bias % = 100 × bias / |expected|. Recovery % = 100 × mean / expected. Both need a nonzero expected concentration on a ratio scale.
- Residual SD = √(SSE / (n − 2)) over the n level means.
- R-squared = 1 − SSE / SST.
- Intervals: slope, intercept and fitted response use levels − 2 degrees of freedom. Each level mean uses replicates − 1.
Theoretical values
Section titled “Theoretical values”The two held-true levels keep their measured means as expected values. The step is (mean of the higher held-true level − mean of the lower) ÷ (difference in their level numbers), and every other level's expected value is the lower held-true mean plus its distance in levels times the step. A skipped level keeps its place: measuring levels 1, 2, 3 and 5 still puts level 5 four steps above level 1.
Example. A five-level fibrinogen kit reads 196, 338, 479, 621 and 763 mg/dL. Holding levels 1 and 3 true gives a step of (479 − 196) ÷ 2 = 141.5 mg/dL and expected values 196, 337.5, 479, 620.5 and 762 mg/dL, so level 5 has a bias of 1 mg/dL. Holding levels 1 and 5 true gives 196, 337.75, 479.5, 621.25 and 763 mg/dL.
Sources: NIST/SEMATECH e-Handbook §1.3.5.2 and §1.3.5.6; Xiao and Chambliss (2023) for the reportable-range check; 42 CFR 493.1255 for a minimal (or zero) value at the low end. See Study reference.
Evidence references: CAP COM.40300, COM.40350, CHM.13550, CHM.13600, HEM.37373, HEM.37375, IMM.33800, IMM.33818, MIC.65160, MIC.65170, POC.08500, POC.08600 (9 December 2025). In a binder, the CAP evidence index lists the report sections behind each requirement and the laboratory records that go with them.