


Interference reference
Interference measures how far the result moves when a substance is added to a specimen. A pool is split into a control aliquot, with only the vehicle, and test aliquots with the interferent at known concentrations. Each test aliquot is compared with the control from the same pool, and each analyte level, for example low and high, is analyzed separately.
Settings
Section titled “Settings”| Setting | Where | What it does |
|---|---|---|
| Interferent, Interferent concentration unit | New study, Interference settings | The added substance, for example hemoglobin, and the unit of its concentrations, for example g/L |
| Claimed maximum interferent concentration | Interference settings | Optional. A claim above the highest tested concentration is flagged |
| Interference effect | Acceptance limits, Enter your own limit | The largest acceptable effect in the study unit, as a percentage of each combination's control mean, or both |
| Relative interference effect (%) | Acceptance limits, More statistics | A limit on the relative effect |
A pool is one prepared specimen split into aliquots. It is the independent unit. Each pool and analyte level has:
- one control aliquot: vehicle added, no interferent;
- one test aliquot for each interferent concentration;
- optionally one base aliquot: the neat specimen with nothing added.
The design is named from the data: a level with two or more matched concentrations is a Concentration response, and a level with one is a Screening.
Columns
Section titled “Columns”| Column use | Grid column | Required | What to enter |
|---|---|---|---|
| Specimen or material ID | Pool ID | Yes | Shared by the base, control and test aliquots of one pool, for example P1 |
| Sample role | Role | Yes | base (neat specimen), control (vehicle-matched, no interferent) or test (with interferent), any case |
| Interferent concentration | Interferent concentration | Yes | For test aliquots, the added concentration, above 0, in the unit set on Set up. For control and base aliquots, empty or 0 |
| Result | Result | Yes | The measured analyte result in the study unit |
| Level or group | Analyte level | No | For example low, high. A blank level becomes 1 when the study is saved |
| Replicate | Replicate | No | At least 2 per aliquot for an interval |
The calculation stops for:
- marked rows, such as a missing role, a test with no concentration, or a control or base with one;
- a missing interfering substance or unit;
- two controls for one pool and level, or a repeated replicate label within an aliquot.
Acceptance limits
Section titled “Acceptance limits”A level with no applicable acceptance criterion keeps each matched combination Not evaluated and shows a warning naming the level.
Each matched combination is compared with the acceptance limit on unrounded values, and its last column, Result, shows the outcome:
- Not met when the effect is outside the limits.
- Met when the whole interval is within the limits.
- Undecided when:
- the effect is inside but the interval reaches beyond the limits;
- there is no interval;
- fewer than 2 pools were tested at that level and concentration;
- a test has no matched control.
A percent limit is taken of each combination's control mean; with both parts, Either and Both use the limits in Calculations and sources. Percent effects need a ratio scale and a clearly positive control mean. Without them there is no percent effect, and a percent limit can't be used. With Either, the study-unit limit is then used alone; with Both, the combination can exceed the limit but can't be within it.
A single-value interval at an inclusive limit counts as inside. The study status comes from the acceptance limits. See About acceptance decisions and Set acceptance limits.
Results and plots
Section titled “Results and plots”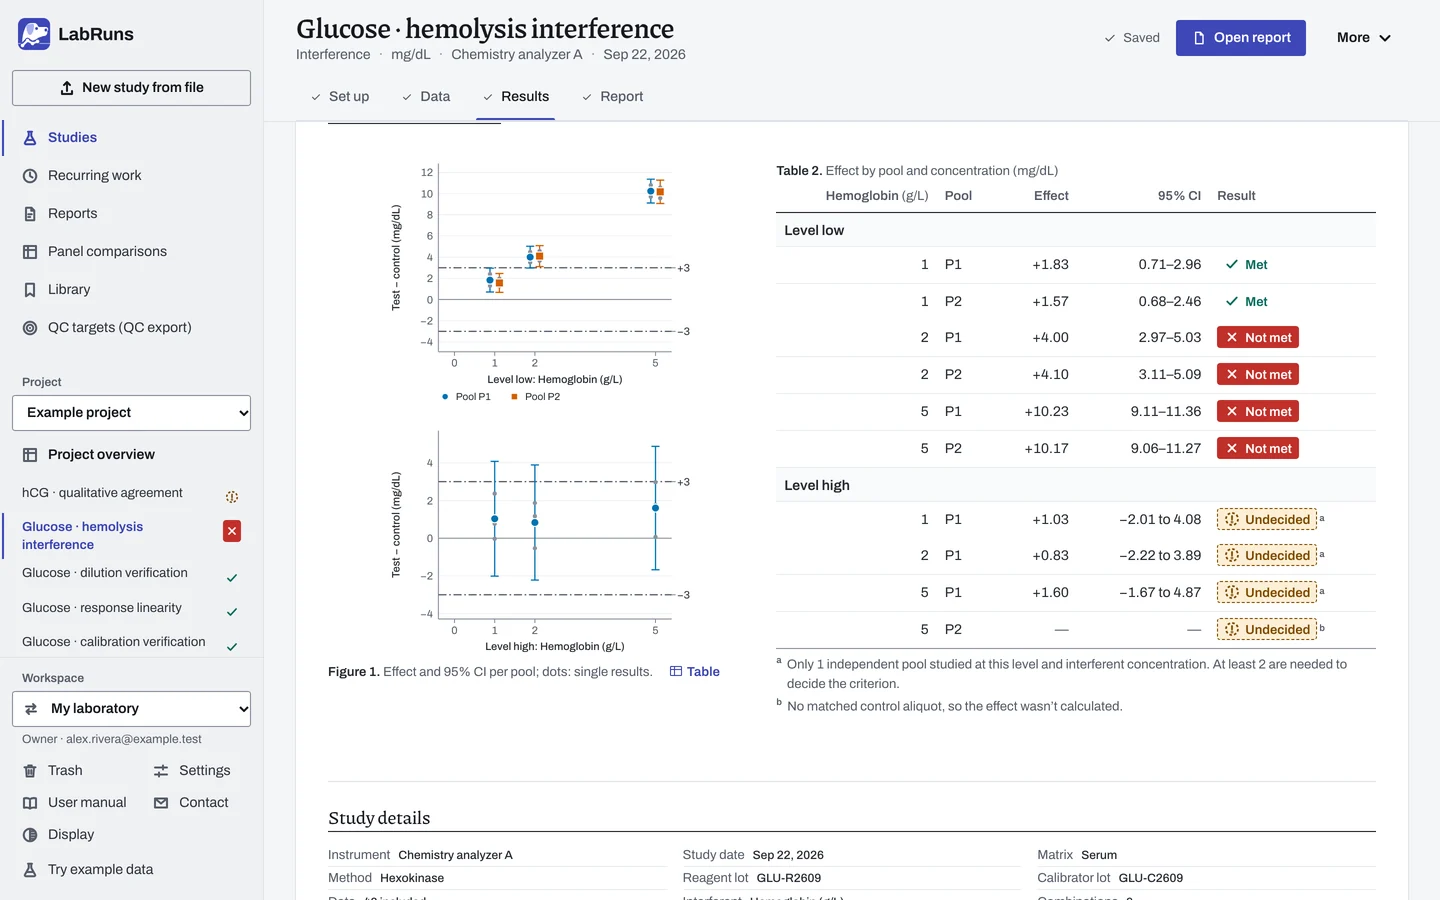
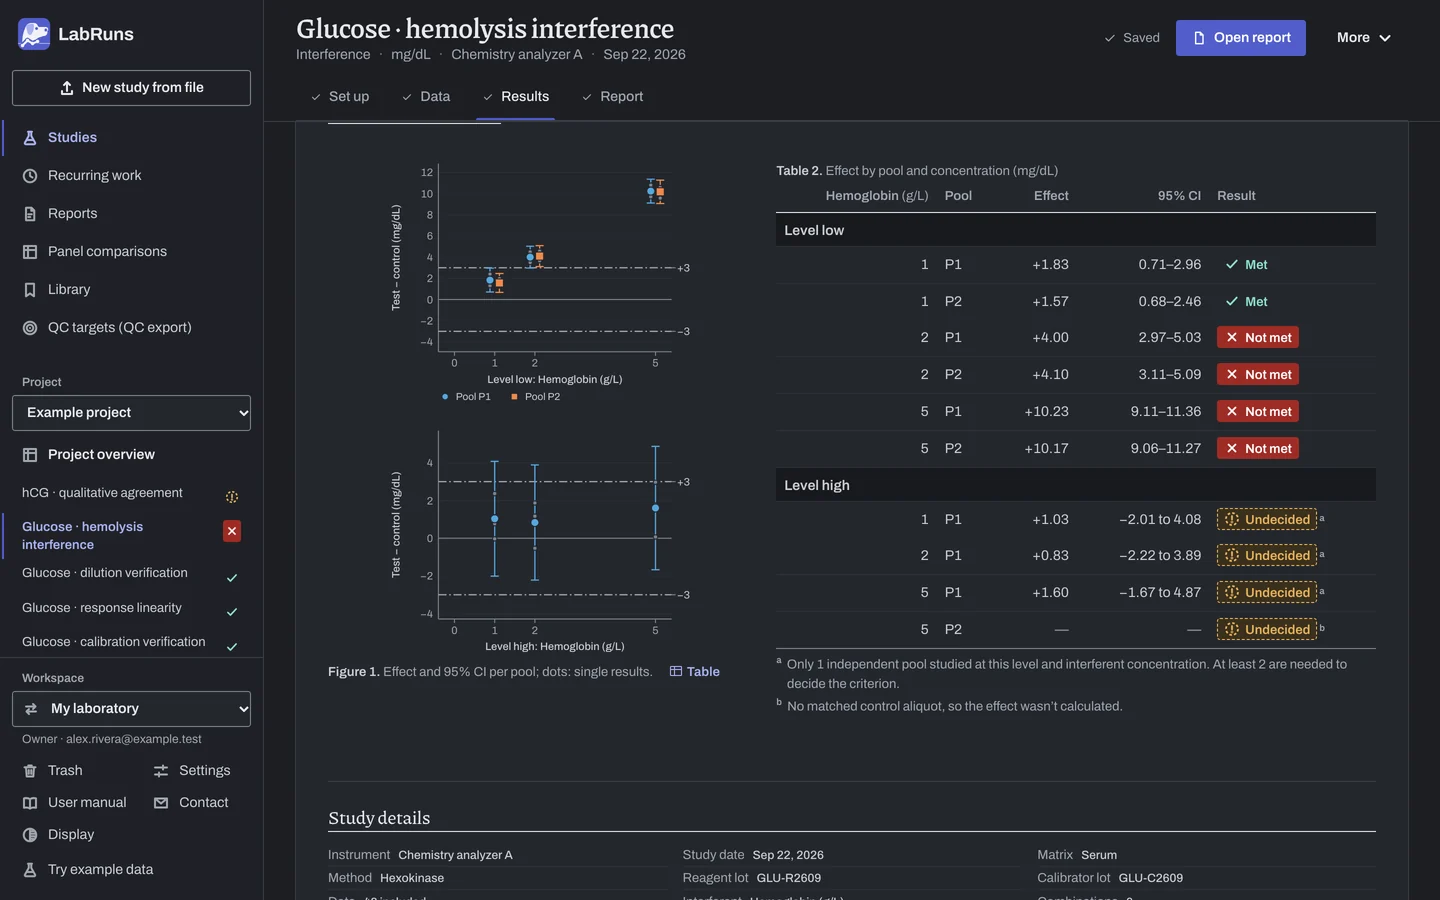
Analyte level details chooses the level whose supporting details are shown. The plot shows each pool's effect at its interferent concentration with its interval; dots are single test replicates minus the control mean. A limit in the study unit shows as dashed lines at ±limit. A percent, either or both limit shows as short dashed marks at each combination. Effects that grow with concentration and intervals that reach the limit show in this plot.
Effect by pool and concentration lists each concentration and pool with its effect, interval and result; a test aliquot without a control shows dashes. The acceptance table below it names the concentrations within and beyond the limit. Under Results, Means behind each effect gives the control and test means, and Vehicle effect compares each control with its base when one was entered. Detailed statistics → Combinations · level … adds the replicate counts and the relative effect.
The PDF report's first page shows the effect plot for each level, each pool and concentration with its effect, interval and result, and one acceptance row per level naming the concentrations that met the limit. Every entered result, then the control and test means and the vehicle effect, follow on the next pages.
Example
Section titled “Example”interference.csv is example glucose data (mg/dL) with hemoglobin (g/L) as interferent:
- Level
low: poolsP1andP2, each with base, control and tests at 1, 2 and 5 g/L; 3 replicates each (30 rows). - Level
high: poolP1with base, control and tests at 1, 2 and 5 g/L; poolP2has only a test at 5 g/L and no control (18 rows).
Setup: interferent Hemoglobin, unit g/L, claimed maximum 10, 95% confidence. Both levels have three matched concentrations, so each is a Concentration response. One acceptance limit: Interference effect within ±3 mg/dL, inclusive, all levels.
| Pool, interferent | Control mean → test mean | Effect | 95% CI | Result |
|---|---|---|---|---|
| P1, 1 g/L | 80.10 → 81.93 | +1.83 | 0.71–2.96 | Met |
| P2, 1 g/L | 75.33 → 76.90 | +1.57 | 0.68–2.46 | Met |
| P1, 2 g/L | 80.10 → 84.10 | +4.00 | 2.97–5.03 | Not met |
| P2, 2 g/L | 75.33 → 79.43 | +4.10 | 3.11–5.09 | Not met |
| P1, 5 g/L | 80.10 → 90.33 | +10.23 | 9.11–11.36 | Not met |
| P2, 5 g/L | 75.33 → 85.50 | +10.17 | 9.06–11.27 | Not met |
Level high: pool P1 at 1, 2 and 5 g/L gave effects of +1.03, +0.83 and +1.60 mg/dL with 95% CIs −2.01 to 4.08, −2.22 to 3.89 and −1.67 to 4.87. All three are Undecided, because only 1 pool was tested at each concentration and each interval crosses ±3 mg/dL. Pool P2 at 5 g/L has no control, so no effect is calculated. Its row shows no effect and is Undecided.
Vehicle effect (control − base): P1 low −1.93 mg/dL (95% CI −2.81 to −1.06), P2 low −1.83 (−2.69 to −0.98), P1 high −3.77 (−6.70 to −0.84).
Study status: Criteria not met. A note flags the claimed 10 g/L as above the highest tested concentration, 5 g/L.
With a 3% limit, pool P1 at level low (control mean 80.10 mg/dL) is compared with ±2.4 mg/dL, and at level high (control mean 399.43 mg/dL) with ±11.98 mg/dL. With both 3 mg/dL and 3% and Pass when within either (the larger allowance), the larger applies: ±3 mg/dL at level low and ±11.98 mg/dL at level high. With Pass only when within both, the smaller applies: ±2.4 and ±3 mg/dL.
Calculations and sources
Section titled “Calculations and sources”When you calculate Glucose · hemolysis interference in the example project, LabRuns records these methods:
- Included rows form aliquots by pool, analyte level, role and interferent concentration. Replicates are repeat measurements of one aliquot. Each pool is one independent preparation.
- Each test aliquot is compared with the control aliquot of the same pool and analyte level. The effect can’t be calculated without a matched control.
- Effect = test mean − control mean, with SE = √(s_t²/n_t + s_c²/n_c) and Welch–Satterthwaite degrees of freedom (NIST/SEMATECH §1.3.5.3). The two-sided 95% Welch t interval needs at least 2 replicates per aliquot; when every replicate agrees in both aliquots the SE is 0 and the interval is the effect itself.
- Relative effect = 100 × effect / control mean. It needs a ratio scale and a positive control mean. Its interval is the absolute interval divided by the same control mean.
- Each combination is within when its interval lies inside ± the limit, exceeds when the interval lies entirely beyond one side, and is inconclusive otherwise, including when there is no interval. The limit is in the study unit, a percent of the control mean, or both: with either, the larger allowance applies; with both, the smaller.
- The vehicle effect, control mean − base mean, is reported separately from the interference effect.
- Conclusions cover the studied combinations only. A claimed maximum above the highest studied concentration gives a warning.
- A criterion is met when the effect’s whole interval lies within its limits. A limit that depends on concentration takes its allowance from each combination’s control mean. A point estimate inside the limits with a wider or missing interval gives no decision. A point estimate outside the limits does not meet the criterion.
df (Welch)        = SE⁴ / [ (s_test²/n_test)²/(n_test − 1) + (s_control²/n_control)²/(n_control − 1) ]
Interval          = Effect ± t(1 − α/2, df) × SE
Percent limit     = limit % × |control mean| / 100      (then compared in the study unit)
- A positive effect means the interferent pushed results up.
- SDs use n − 1. A single-value interval, when every replicate agrees within both aliquots, is decided like any other interval, and the result notes why.
- The relative interval treats the control mean as fixed.
- Decimal effects are calculated before rounding: 140.4 minus 140 is exactly 0.4.
Sources: NIST/SEMATECH e-Handbook §1.3.5.3 (Welch–Satterthwaite) and §1.3.5.6. Study-design reference: NIST Welch interval. See Study reference.
Evidence references: CAP COM.40350, COM.40500 (9 December 2025). In a binder, the CAP evidence index lists the report sections behind each requirement and the laboratory records that go with them.