


Sigma metric reference
A sigma metric study reports, at each stated concentration, how many SDs fit between the bias and the allowable total error, with a descriptive grade and suggested QC rules. See sigma metric and TEa.
Settings
Section titled “Settings”Measurement scale, under Calculation settings, is Ratio scale · CV usable by default. With Interval scale · no CV, for an analyte with no true zero, new entries start with TEa, bias and SD in the study unit. A study percentage allowance or constant-CV precision extrapolation leaves the affected entry Not computed and its minimum Undecided.
Full allowable error
Section titled “Full allowable error”Total allowable error is entered in the study unit, percent, or both. With both, the larger allowance applies at each concentration. A sigma study created from an analyzer profile copies the full allowance and the profile's decision concentrations. The systematic and random-error shares do not reduce sigma's TEa. With both boxes blank, TEa is entered separately for each concentration.
Bias and precision models
Section titled “Bias and precision models”Use saved studies or precision summaries holds the models that fill entries during calculation:
- Copy bias model copies the primary fit from an independent method comparison of the same analyte and unit in this project. A calculated theoretical line is not an independent bias estimate.
- Copy selected precision points copies within-laboratory SDs from saved multi-day precision studies.
- You can type Comparison slope and Comparison intercept. Within-laboratory precision summaries accepts one concentration, SD and outside-range model per line. Apply the entered models with Use these models:
100, 1.5, SD
200, 3, CV
The outside-range model, SD or CV, is the quantity held constant beyond that end of the measured precision points. Interval-scale measurements use SD.
Model-derived inputs are filled during calculation; the Data cards ask only for the remaining inputs. Use individual entry inputs returns to separate entry values. Editing a copied model coefficient or SD removes its source link; unchanged copied values retain their links.
Columns
Section titled “Columns”Sigma has no data grid and no import. Data holds up to 20 concentration entries, each calculated separately. Each entry needs these inputs, supplied either by its Set up models or in the card:
| Field | What to enter |
|---|---|
| Concentration | Above zero, in the study unit |
| TEa and TEa is entered as | Above zero, as Percent of the concentration or Absolute · {unit} |
| Bias (signed) and Bias is entered as | Test minus reference or target, as a percent or an absolute value |
| Imprecision and Imprecision is entered as | 0 or above, as CV · % or SD · {unit} |
Numbers use a decimal point.
Copying from saved studies
Section titled “Copying from saved studies”Saved bias and precision estimates lists estimates from the other studies in this project that have exactly the same analyte and unit and a saved calculation (a study's signed-off calculation, otherwise its latest). Copy selected estimate fills in the value, links it, and records the kind of evidence and the concentration it was measured at. It can copy:
- bias from a Bias check level, or a Method comparison medical decision level inside the measured range.
- imprecision: the within-laboratory SD or CV from Multi-day precision, or the SD or CV from Repeatability or Descriptive summary.
A copied value keeps the form selected under Bias is entered as or Imprecision is entered as when the estimate has it, and otherwise switches to the form it has. Editing a copied value by hand removes its link.
- Use CLIA / CAP TEa appears when the analyte matches the CLIA / CAP table. A limit such as ±8% or 6 mg/dL (greater) needs the concentration first and uses whichever part is larger there; a later entry, or a changed concentration, takes the larger part at its own concentration. On an interval scale the TEa is given in the study unit.
- Use last TEa appears when a sigma study in this project with the same analyte and unit already has a TEa, and copies the most recent one.
When an entry is not calculated
Section titled “When an entry is not calculated”- Not computed when the concentration, TEa, bias or imprecision is missing, or a percent input is used on an interval scale. The entry lists the reason.
- Undefined when the imprecision is 0.
- A sigma of zero or below is flagged. The bias uses up the whole TEa.
Acceptance limits
Section titled “Acceptance limits”An optional Minimum acceptable sigma gives a direct decision at each concentration: the unrounded sigma must be at least the number you type. An entry that would meet it with a value copied from a study that has changed since is Undecided until you link the value again. If you leave it blank, the study still saves and calculates, as a descriptive result. The minimum is the only acceptance limit; the descriptive grade and the suggested QC rules only describe the result.
Results and plots
Section titled “Results and plots”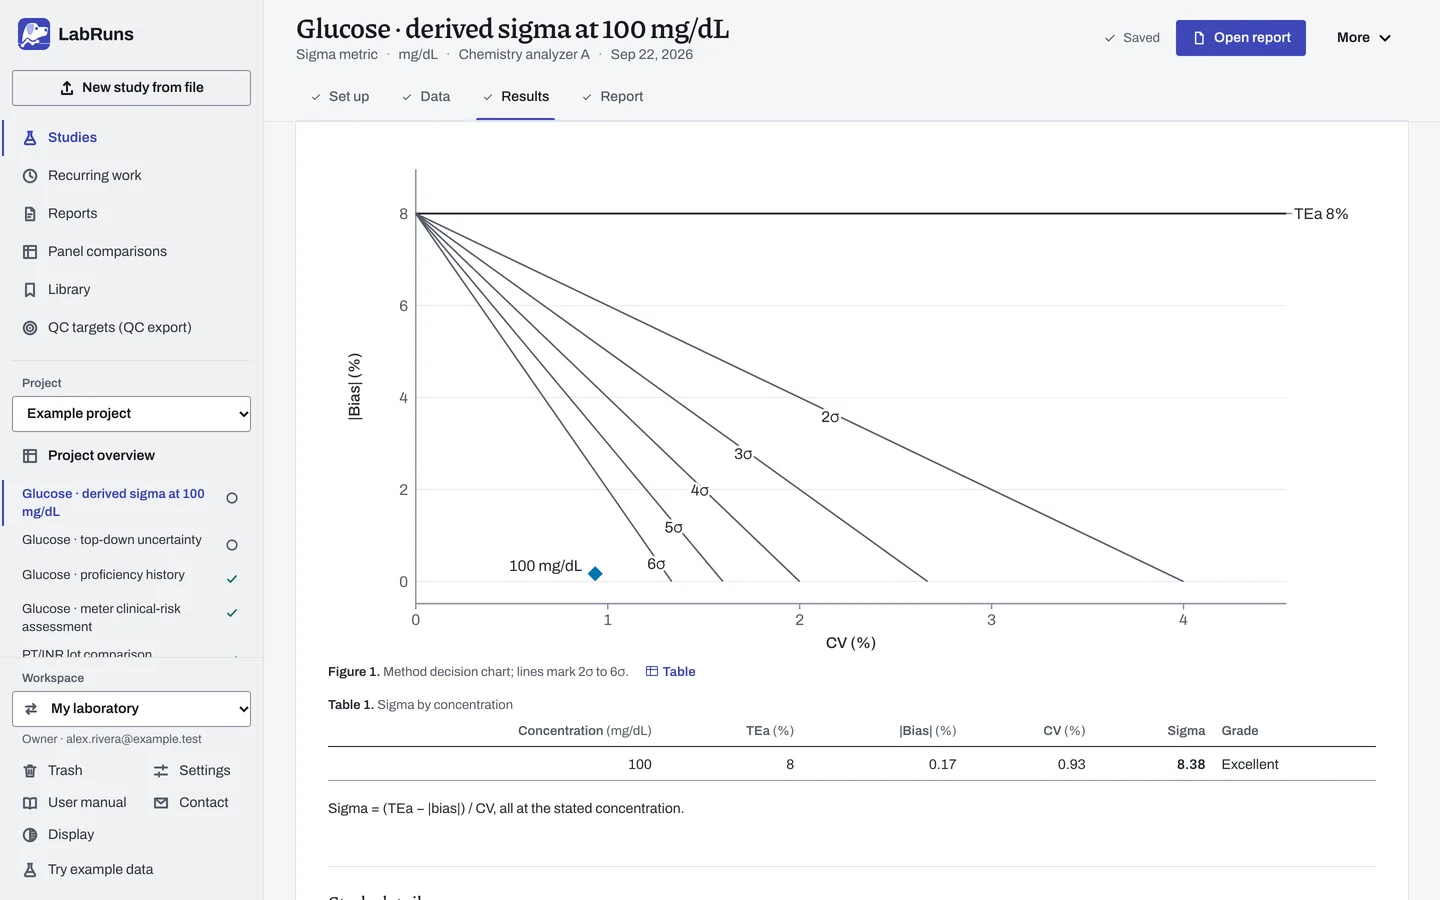
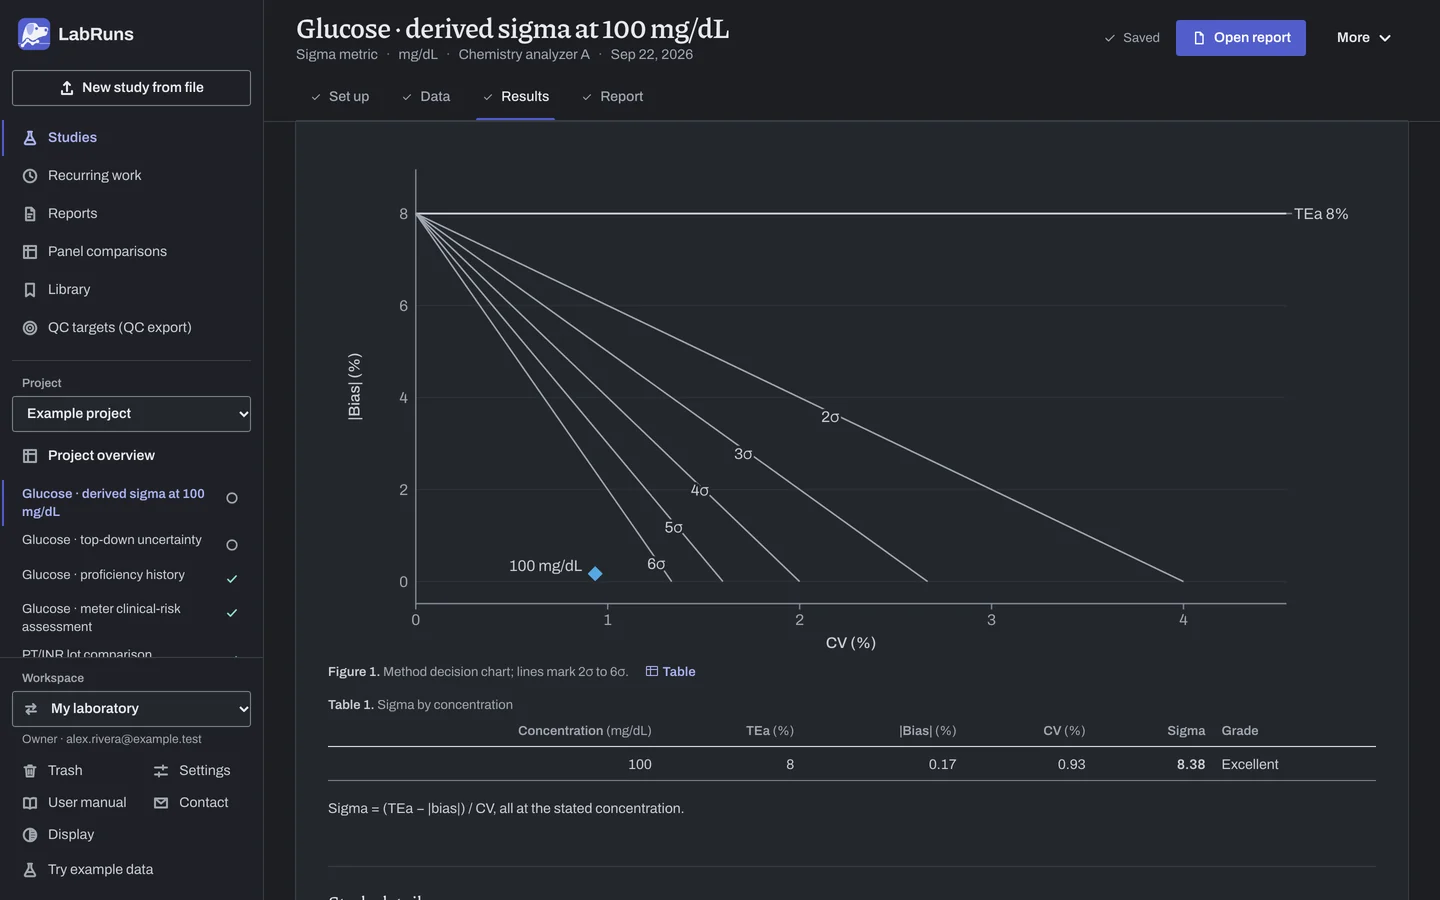
Derived sigma by concentration lists each entry with its inputs, sigma, and any reasons and flags. Percentages show the study-unit value beneath.
Each sigma also gets a descriptive grade: Excellent at sigma ≥6, Good at 4–<6, Fair at 3–<4, Marginal at 2–<3 and Unacceptable below 2.
The suggested QC rules assume two control levels, and N is the total number of control measurements in each run:
| Sigma | Starting rules | Control measurements |
|---|---|---|
| ≥6 | 1:3s | N=2, one run |
| 5–<6 | 1:3s, 2:2s, R:4s | N=2, one run |
| 4–<5 | Add 4:1s | N=4, one run; or N=2 across two runs |
| <4 | Add 8:x | N=4 across two runs; or N=2 across four runs |
R:4s applies within a run. Below 3 sigma, even these rules do not establish adequate QC performance.
If a linked study changes after copying, Data warns under the entry. Results, new report copies, CSV downloads and the project report show Results out of date. Signing off is refused while a linked value is out of date.
The report's first page has a decision chart of |bias| against imprecision with lines for 2σ to 6σ and Sigma by concentration; when every entry has the same kinds of evidence, one sentence names them. Inputs and their evidence, after the data listing, names the evidence behind each bias and imprecision: its kind, the study a copied value came from and, when it differs from the entry's, the concentration it was measured at.
Example
Section titled “Example”The study Glucose · derived sigma at 100 mg/dL in the example project copies its values from two other studies in that project:
- a bias of 0.17 mg/dL from Glucose · assigned-target bias check, level 1, assigned 100 mg/dL
- a CV of 0.93 % from Glucose · single-run repeatability, level 1, mean 100.17 mg/dL
Entry 1 has concentration 100 mg/dL, and TEa 8 % as Percent of the concentration. Derived sigma by concentration in Results shows:
| Column | Displayed value |
|---|---|
| Concentration | 100 mg/dL |
| TEa | 8.00% (8.00 mg/dL) |
| |Bias| | 0.17% (0.17 mg/dL) |
| CV | 0.93% (0.93 mg/dL) |
| Sigma | 8.38 |
Because the CV comes from single-run repeatability, Results adds Entry 1 at 100 mg/dL: single-run repeatability understates imprecision, so sigma is overstated.
| Entry | Result shown |
|---|---|
| TEa 10 %, bias 1 %, CV 2 % at 100 mg/dL | 4.50 |
| The same with imprecision 0 | Undefined |
| TEa 10 %, bias 12 %, CV 2 % (bias larger than TEa) | −1.00, flagged |
| TEa 6 mg/dL, bias −0.5 mg/dL, SD 1.5 mg/dL at 50 mg/dL (absolute inputs) | 3.67 |
Calculations and sources
Section titled “Calculations and sources”When you calculate Glucose · derived sigma at 100 mg/dL in the example project, LabRuns records these methods:
- Sigma metric after Westgard, Bayat and Westgard 2019, Eq. 5: SM = (TEa − |bias|) / SD at one stated concentration, all in the same unit. This equals (TEa% − |bias|%) / CV%. No 1.5 SD shift is added.
- Values are converted through the stated concentration C: TEa% = 100·TEa/C, |bias|% = 100·|bias|/C, CV% = 100·SD/C, and back (SD = CV%·C/100). Percent inputs need a ratio scale. On an interval scale, only entries with TEa, bias and SD in the study unit are calculated.
- An entry missing its concentration, TEa, bias or imprecision has no sigma. Zero imprecision leaves sigma undefined.
- Values copied from other studies keep their source study and sign-off state. Evidence from another concentration shows how far it is from C.
- Regression bias is intercept + (slope − 1) × concentration. Within-laboratory SD is linearly interpolated between adjacent precision points; outside them the nearest point uses its stated constant-SD or constant-CV model.
- The full total-error allowance is the greater of its absolute and concentration-based percentage components. Percentage study allowances and constant-CV extrapolation need a ratio scale; an entry requiring either on an interval scale has no sigma. Optional minimum sigma is compared directly, without statistical allowance.
- Descriptive grades: Excellent ≥6; Good ≥4; Fair ≥3; Marginal ≥2; Unacceptable <2. QC guidance uses the two-control-level Westgard Sigma Rules.
Precision between points
Section titled “Precision between points”Between precision points the SD is interpolated linearly. With the lines 100, 1.5, SD and 200, 3, CV, the SD at 150 mg/dL is 2.25 mg/dL. Below 100 the first point keeps SD at 1.5; above 200 the last point keeps CV at 1.5%, giving SD 4.5 at 300. Calculations outside the measured precision or comparison range are marked extrapolated.
Source: Westgard S, Bayat H, Westgard JO (2019), Biochemia Medica 29(1):010903, Eq. 5. Another view: Coskun A, Serteser M, Ünsal I (2019), Biochemia Medica 29(1):010902. See Study reference.