


Reagent lot comparison reference
A reagent lot comparison checks every specimen's difference between the previous and new lots against its allowable difference, with the lot plan's coverage and any QC material alongside. One study compares one pair of lots. Differences are new lot minus previous lot. A negative difference means the new lot reads lower.
Settings
Section titled “Settings”| Setting | Meaning |
|---|---|
| Previous lot name, New lot name | Asked in New study, and shown under Study details on Set up. When the data hold two lots that the names don't match, Which lot is in use now? replaces them; the other lot is the new lot |
| Planned concentration groups | Under Lot plan. A new study starts with the suggested 3 groups × 20 pairs. Each group has a Level, Required pairs and an optional Range low and Range high in the study unit; the range is checked against previous-lot results. Importing results keeps these requirements, including groups with no results yet |
| Required matched pairs | The total of the groups' required pairs |
| Every specimen must be within its limit | Under Specimens that must pass. Ticked, every specimen must be within its limit however many are tested. Left off, at least 95% must be, which is every one of fewer than 20 |
| Saved lot plan | Under Lot plans: plans saved for the same analyte and unit. A saved lot plan carries no acceptance limits |
| Claimed lower reportable limit, Claimed upper reportable limit | Under Reportable-range coverage (optional). With both, the saved result shows the percentage of that interval spanned by matched specimen means on the previous lot. It describes the tested span. Acceptance and reportable-range verification are separate |
More → New study from this setup copies the plan and acceptance limits with empty data and lot names.
Columns
Section titled “Columns”| Column use | Grid column | Required? | What to enter |
|---|---|---|---|
| Specimen or material ID | Specimen ID | Yes | Coded ID, the same on both lots. An ID beginning with QC (any case) marks quality-control material |
| Lot | Lot | Yes | One of the two lots. With two lots in the data, Which lot is in use now? on Set up names them; otherwise it must match the previous or new lot name there exactly |
| Result | Result | Yes | A number in the study unit |
| Level or group | Level | No | The concentration group, one per specimen. Blank puts the specimen in one group, All specimens |
The optional Excluded and Exclusion reason columns are in Fields every study type offers.
The calculation stops while:
- a row is marked, such as a lot name that matches neither lot
- planned ranges are in another unit
- a specimen is in more than one level
- there are no patient specimens, only
QCrows
Without an allowable difference under Acceptance limits, a built-in specimen check stays Undecided and the lot can't reach Criteria met.
Acceptance limits
Section titled “Acceptance limits”The allowance for each specimen is a percentage of its previous-lot result, an amount in the study unit, or both, passing when within either (the larger allowance) or only when within both, as chosen under With both limits. With Concentration-dependent limits, each specimen's previous-lot result picks its segment.
At least 95% of specimens must meet their limit, whatever the mean difference: every one of fewer than 20, 19 of 20, 57 of 60. This is the same percentage rule as method and instrument comparison, with a calculation minimum of 2 paired specimens for this lot study. With Every specimen must be within its limit ticked, every specimen must meet it.
Mean difference is an optional second limit on the mean of new minus previous across the matched specimens, in the study unit (or, in the full editor, as the mean percentage difference of the pair mean). It separates a shift between the lots from the spread of single differences: an unchanged lot on an imprecise method can fail the specimen rule while its mean difference sits near zero, and a precise method can pass the specimen rule with a real shift. The mean is compared at full precision with the entered bounds, inclusive by default, needs at least 2 matched pairs, and a mean beyond the limit is Not met. The specimen rule is always required.
Differences are compared with the limit at full precision. A difference exactly on the limit passes.
| Previous lot | New lot | Limit | Outcome |
|---|---|---|---|
| 100 | 89.9 | 10% | Fail: 10.1 exceeds 10 |
| 100 | 90 | 10% | Pass: exactly on the limit |
| 100 | 110.1 | 10% | Fail: 10.1 exceeds 10 |
| 20 | 22 | Greater of 2 units or 10% | Pass: allowance is 2 |
| 100 | 109 | Greater of 2 units or 10% | Pass: allowance is 10 |
| Situation | Decision |
|---|---|
| At least 2 specimens, all evaluable, the required count within limits, plan complete and every entered mean-difference limit met | Criteria met |
| Too many specimens exceed their limits to reach the required count | Criteria not met |
| A specimen has a result on only one lot | That specimen can't be evaluated. The limit is Undecided unless too many other specimens already fail to reach the required count |
| Fewer than 2 specimens | Undecided |
| Fewer specimens than planned, a group not covered, or specimens outside the plan | Plan incomplete. A passing result becomes Undecided |
| Mean difference beyond an entered mean-difference limit | Criteria not met, whatever the specimen count |
| Percentage limit with a previous result of 0 or below, or on an interval scale | That specimen can't be evaluated. A greater-of rule still uses its absolute part when that part is larger |
Results and plots
Section titled “Results and plots”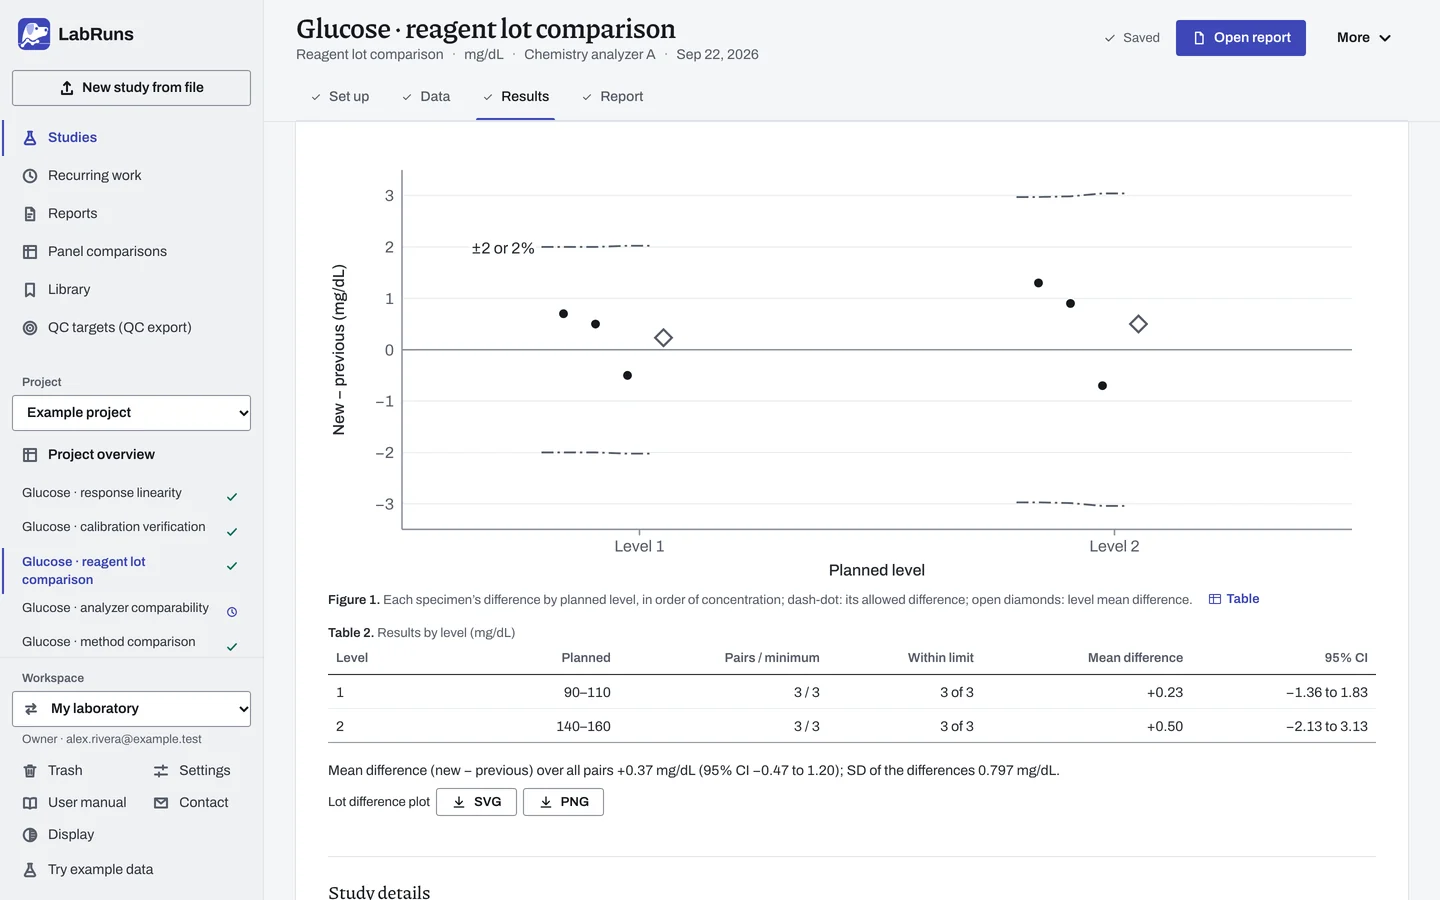
Under Results, Specimen results gives the previous-lot and new-lot values, difference, allowance and outcome for each specimen, including unmatched specimens, followed by QC material with each lot's QC mean. If something else stops the lot passing, such as an incomplete plan, that reason comes first. Plan coverage shows whether each planned group is covered, with its counts and ranges.
Supporting diagnostics → Difference detail holds the SD of the differences and the percentage differences by level and, when specimens were repeated, each lot's within-specimen SD.
Page 1 of the report holds the decision. Two figures plot each specimen's new-lot result against its previous-lot result, with QC materials as open squares, and each difference (new − previous) with its allowed range. With more than one planned group, a table gives one row per group: planned range, Pairs / minimum, specimens within their limits, and mean difference with its 95% CI. Acceptance applies to the whole lot comparison, so a group has no result of its own. The report gives the overall mean difference, its CI and SD once; an entered absolute mean-difference criterion carries the mean in Acceptance criteria. That table lists the specimen limit, lot plan and any entered mean-difference limits, each with its finding and result. The data listing starts on page 2. After it come each specimen's values, difference, allowed difference and outcome, the QC materials on both lots, and the previous-lot results each planned group covered.
Example
Section titled “Example”lots.csv has six example glucose specimens in two groups and one QC material, each measured on LOT-A and LOT-B, 14 rows in all. The example project's study Glucose · reagent lot comparison uses it.
| Setting | Value |
|---|---|
| Previous lot / New lot | LOT-A / LOT-B |
| Required matched pairs | 6, the total of the groups |
| Planned concentration groups | Group 1 has 3 pairs, 90 to 110 mg/dL. Group 2 has 3 pairs, 140 to 160 mg/dL |
| Acceptance limit | Specimen differences: each specimen within 2 mg/dL or 2%, whichever is greater |
| Specimen | Previous lot (mg/dL) | New lot (mg/dL) | Difference (mg/dL) | Allowed difference (mg/dL) | Error index | Outcome |
|---|---|---|---|---|---|---|
| S01 | 98.40 | 99.10 | +0.70 | ±2.00 | 0.350 | Met |
| S02 | 101.20 | 100.70 | −0.50 | ±2.02 | −0.247 | Met |
| S03 | 99.80 | 100.30 | +0.50 | ±2.00 | 0.250 | Met |
| S04 | 148.60 | 149.90 | +1.30 | ±2.97 | 0.437 | Met |
| S05 | 152.10 | 151.40 | −0.70 | ±3.04 | −0.230 | Met |
| S06 | 149.30 | 150.20 | +0.90 | ±2.99 | 0.301 | Met |
Every specimen is Met, and both groups have 3 of 3 pairs inside their planned range. The study status is Criteria met. The mean difference is +0.37 mg/dL, with a 95% CI of −0.47 to 1.20.
With a ±1 mg/dL limit, S04 (+1.30 mg/dL) fails and the study status is Criteria not met, although the mean difference is well inside ±1. In a separate example with S06's new-lot result excluded, S06 can't be evaluated, the plan has 5 of 6 pairs, and the study is Undecided.
Calculations and sources
Section titled “Calculations and sources”When you calculate Glucose · reagent lot comparison in the example project, LabRuns records these methods:
- Each specimen’s replicates are averaged on each lot. Difference = new − previous, in the study unit. A positive difference means the new lot reads higher. Percentage difference = 100 × (new − previous) / mean of the two lot results. It needs a ratio scale, results of 0 or more and a mean above the near-zero floor.
- A specimen measured on one lot only has no difference but counts in the acceptance total.
- The mean shift has a 95% Student t CI.
- The lot passes when at least 95% of patient specimens (rounded up to a whole specimen, so every one of fewer than 20) meet their allowable difference, there are at least 2 specimens and the lot plan is complete. A percentage limit is ± percentage × previous-lot result / 100. It needs a ratio scale and a positive previous-lot result. A combined absolute-and-percentage limit uses the larger allowance, or both must be met, as the limit says. Concentration-dependent limits take each specimen’s segment from its previous-lot result.
- An optional mean-difference limit judges the mean of the matched differences, in the study unit or as the mean percentage difference, against the entered bounds on the exact entered values; it needs at least 2 matched pairs and fails the lot when the mean is beyond it.
- A specimen allowance below 1.96 × the SD of a matched difference from imprecision alone (the pooled within-specimen SD of a level’s replicated specimens on both lots, times √(1/k₁ + 1/k₂) for the replicates each pair averages) is cautioned with the share of specimens imprecision alone would put outside it. The caution changes no decision.
- The lot plan sets the pairs needed at each concentration level. Without one, each level in the data needs the calculation minimum of 2 pairs, and rows without a level form one group. A level is complete when enough pairs fall inside its planned range, if one is set. Missing pairs or unplanned levels make the decision inconclusive.
- Specimen IDs starting with QC are QC material. They are summarized by material and lot and kept out of acceptance. Pass/fail uses the exact entered values.
- Reportable-range coverage is the width of the overlap between the observed reference-axis range and the claimed reportable range, divided by the claimed range width, times 100. It describes the tested span; accuracy and verification of the reportable range are separate questions. Replicate results are averaged by specimen before determining the observed range.
For each specimen, X is its previous-lot result and Y its new-lot result, after averaging replicates. With an absolute allowance A in the study unit and a percentage allowance P:
- Allowance = A, or X × P / 100, or with both limits, as chosen under With both limits: max(A, X × P / 100) for Pass when within either (the larger allowance), min(A, X × P / 100) for Pass only when within both.
- The specimen meets the limit when |Y − X| ≤ allowance.
- Error index = difference ÷ allowance. Values from −1 to +1 meet a symmetric limit.
- Imprecision caution: with single results on both lots, the SD of a matched difference is √2 times the pooled within-specimen SD. The share of specimens outside the allowance is 100 × erfc(allowance ÷ (√2 × SD)).
- Reportable-range coverage runs from 0% to 100%. For example, comparator results from 40 to 240 mg/dL cover 71.4% of a claimed 20–300 mg/dL interval.
For 20 → 22 and 100 → 98 the percentage differences in the results file average 3.75%; as a percentage of the previous lot, the denominator of a percentage limit, the same differences average 4%. The per-specimen limit and, when entered, the mean-difference limit decide the lot.
Sources and the numerical checks behind these calculations: Study reference.
Evidence references: CAP COM.30450 (9 December 2025). In a binder, the CAP evidence index lists the report sections behind each requirement and the laboratory records that go with them.