


PT and INR reference
A PT and INR study answers one of three questions, each with its own settings and decision rule. Normal PT mean and intervals calculates the geometric mean normal PT and checks counts within proposed PT and INR intervals. INR programming check checks reported INR arithmetic. PT/INR lot comparison checks separate specimen allowances for PT and derived INR between reagent lots.
Settings
Section titled “Settings”The Question on Set up determines the data columns. PT results are in seconds, with s as the study Unit.
| Question | Settings on Set up |
|---|---|
| Normal PT mean and intervals | ISI; Lower PT interval limit (s) and Upper PT interval limit (s); Lower INR interval limit and Upper INR interval limit; Allowed outside each interval, initially 2 |
| INR programming check | The programmed Mean normal PT (s) and ISI. The reporting precision comes from each reported INR entry |
| PT/INR lot comparison | Under Reagent lots: both lot names and each lot's ISI and mean normal PT. Under Specimen allowances: separate PT and INR allowances, each absolute, percentage or both, and Every specimen must be within its limit. Under Supporting regression: the Primary regression and, for a Deming model, its assumed Error-variance ratio, initially 1. Under Lot plan: each level's Required pairs and optional previous-lot PT range |
Columns
Section titled “Columns”| Grid column | Question | Required? | What to enter |
|---|---|---|---|
| Specimen ID | All | Yes | Coded specimen ID. Repeated measurements use the same specimen ID |
| PT (s) | Normal PT mean and intervals, INR programming check | Yes | PT in seconds |
| Day | Normal PT mean and intervals | No | The specimen's collection day |
| Reported INR | INR programming check | Yes | The INR as the analyzer displays it, with its decimal places |
| Previous PT (s), New PT (s) | PT/INR lot comparison | Yes | Each lot's PT for the specimen, on the same row |
| Level | PT/INR lot comparison | No | The concentration group in the lot plan |
| Replicate | All | No | Replicate label |
Normal studies and lot comparisons average repeated PT values within specimen before calculation. Programming checks evaluate every reported pair at its entered precision: 2.30 has a tolerance of 0.01; 2.3 has a tolerance of 0.1. ISI, mean normal PT, intervals and lot allowances belong on Set up.
Acceptance limits
Section titled “Acceptance limits”- Normal PT mean and intervals: the number of specimens outside each proposed interval is compared with Allowed outside each interval, a laboratory-selected count rule. Both interval endpoints count as within.
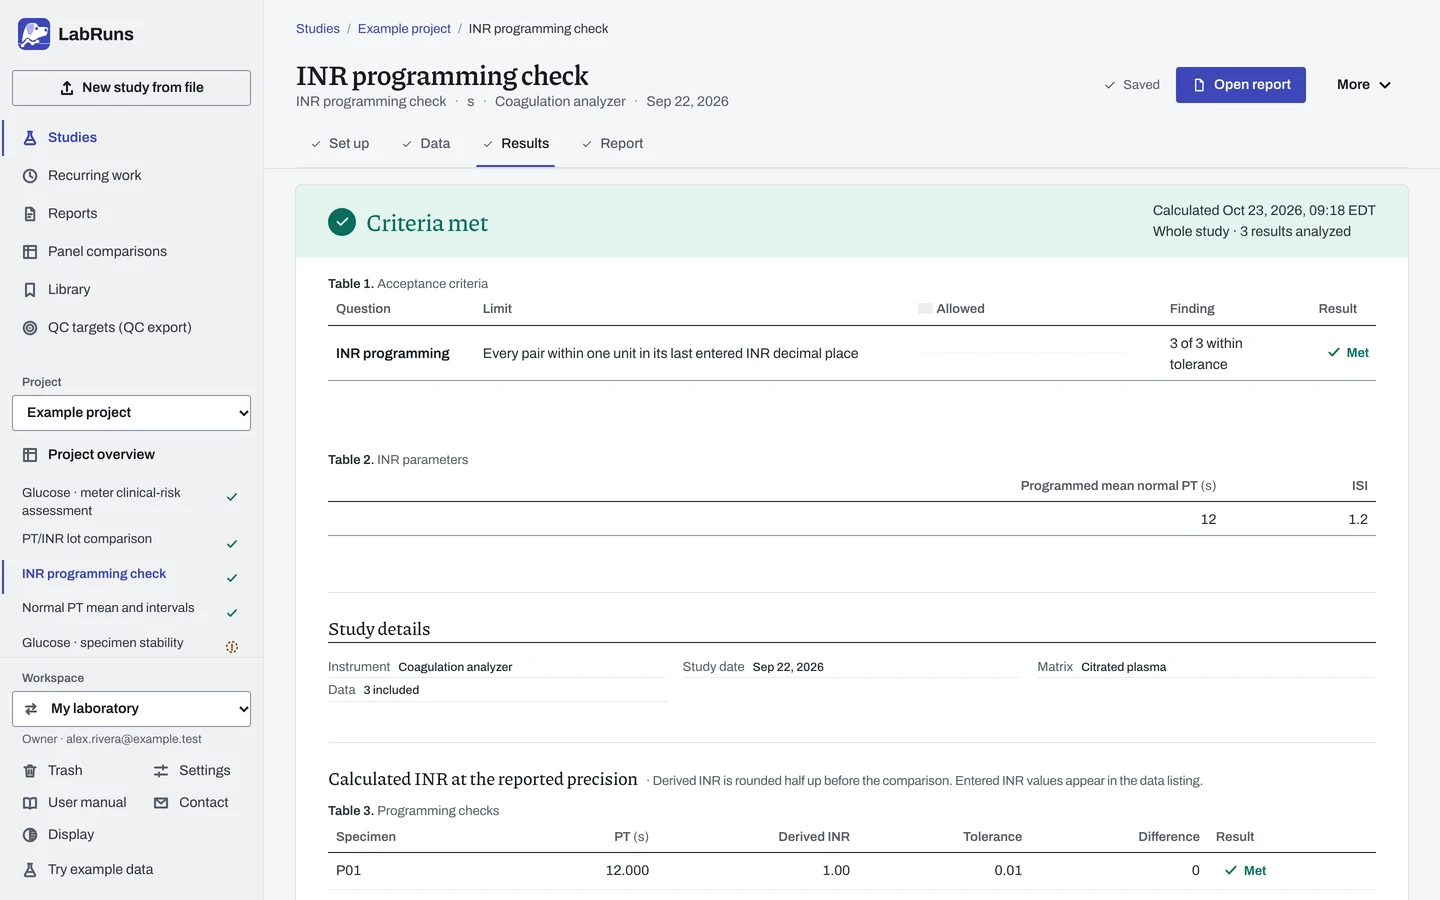
- INR programming check: every pair must be within tolerance: the derived INR, rounded to the reported precision, may differ from the reported INR by no more than one unit in the last entered decimal place.
- PT/INR lot comparison: PT and INR each have their own specimen allowance. An absolute allowance applies directly; a percentage applies to the previous-lot result. When both are entered, the larger applies. At least 95% of specimens must meet each allowance, rounded up to a whole specimen. This requires every one of fewer than 20. Every specimen must be within its limit requires every specimen at any count. At least two paired specimens and a complete plan are required. Specimen allowances alone decide acceptance; regression statistics support the comparison.
Results and plots
Section titled “Results and plots”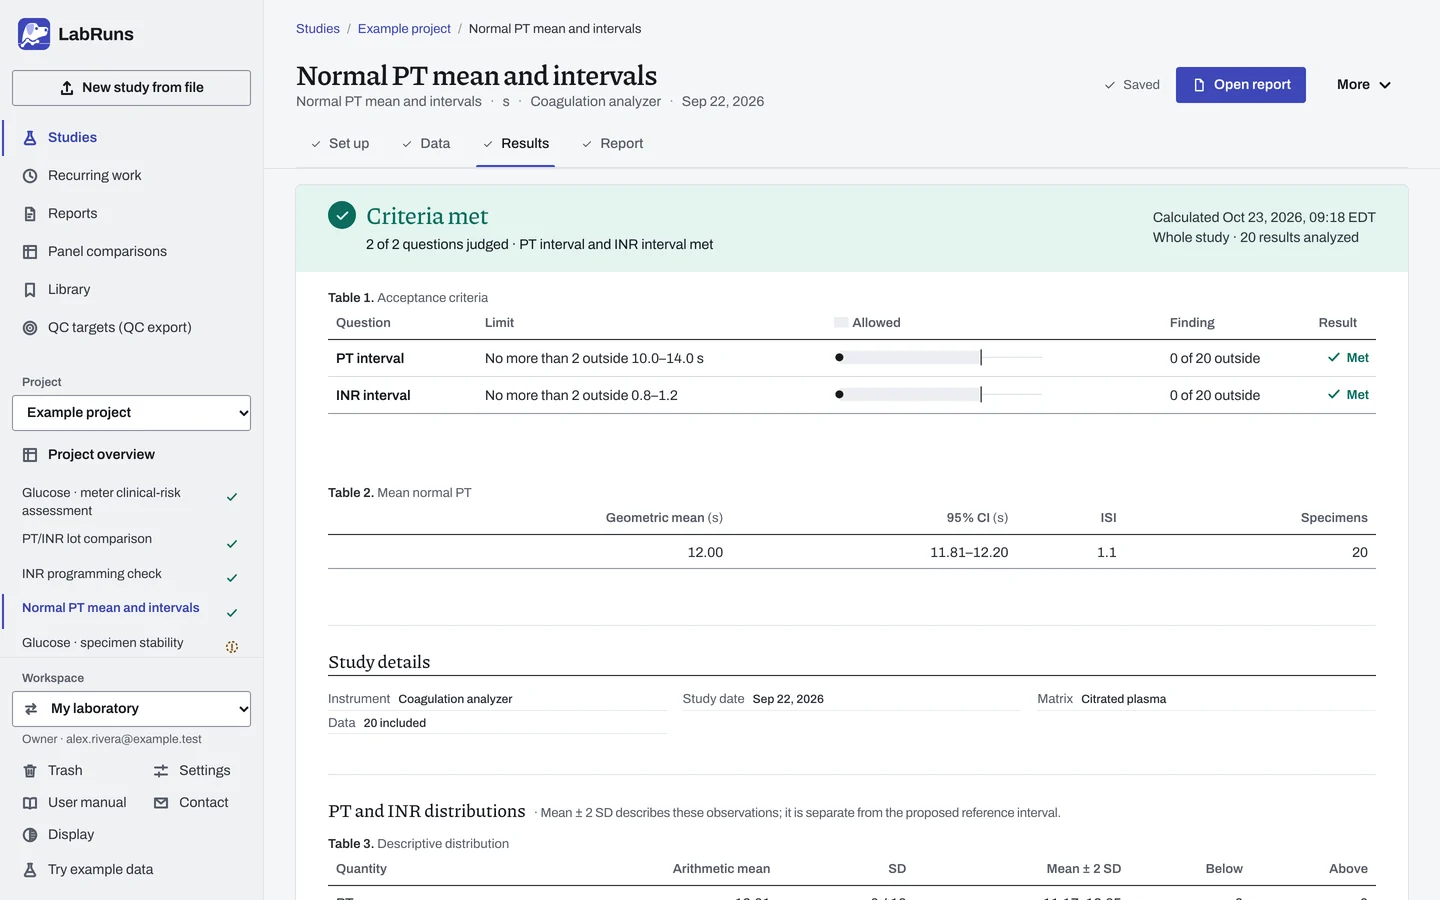
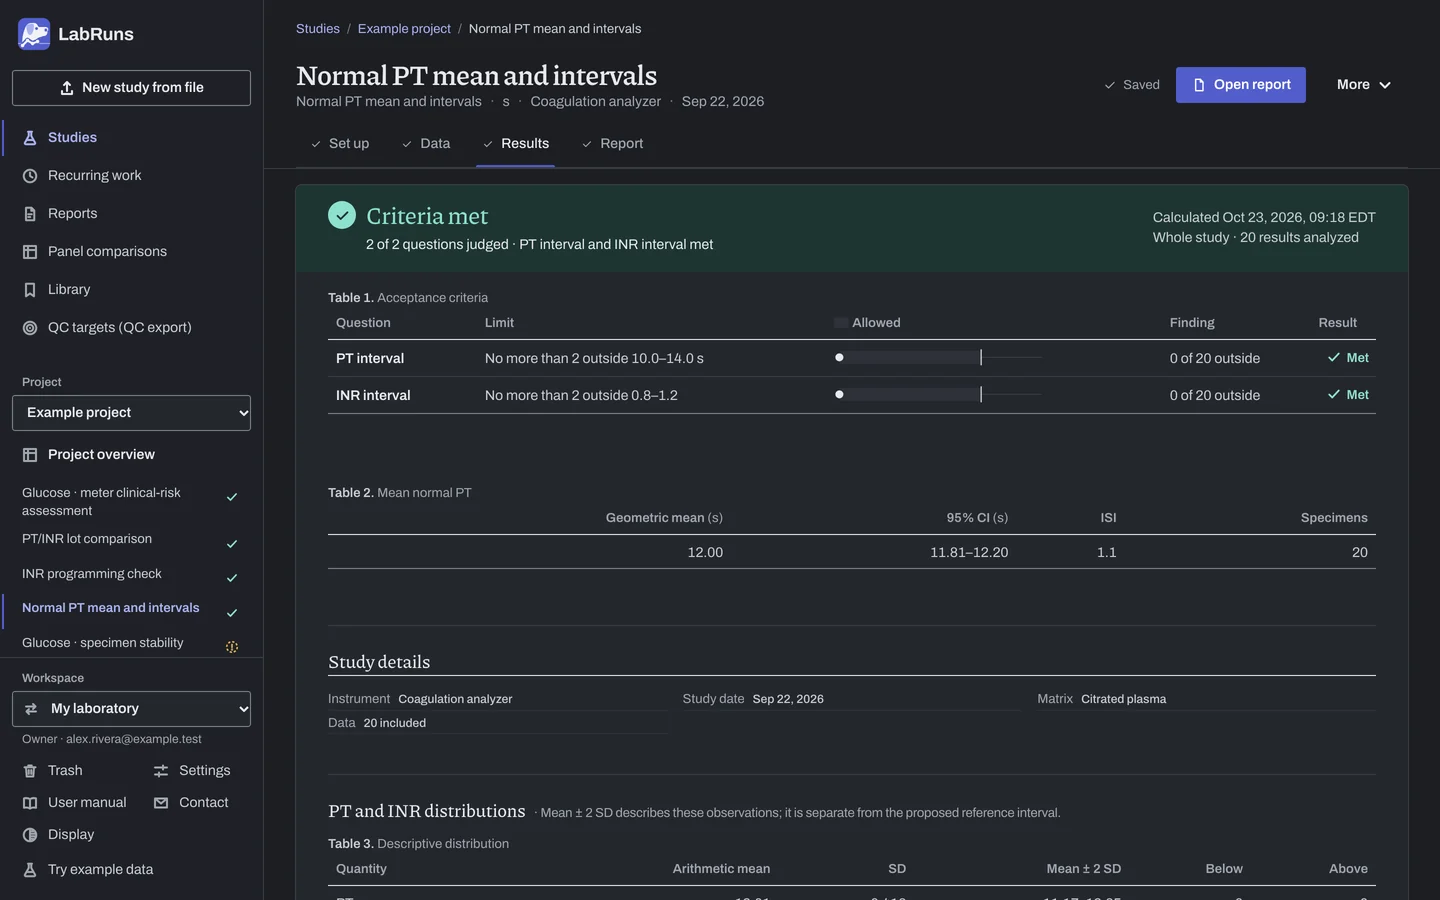
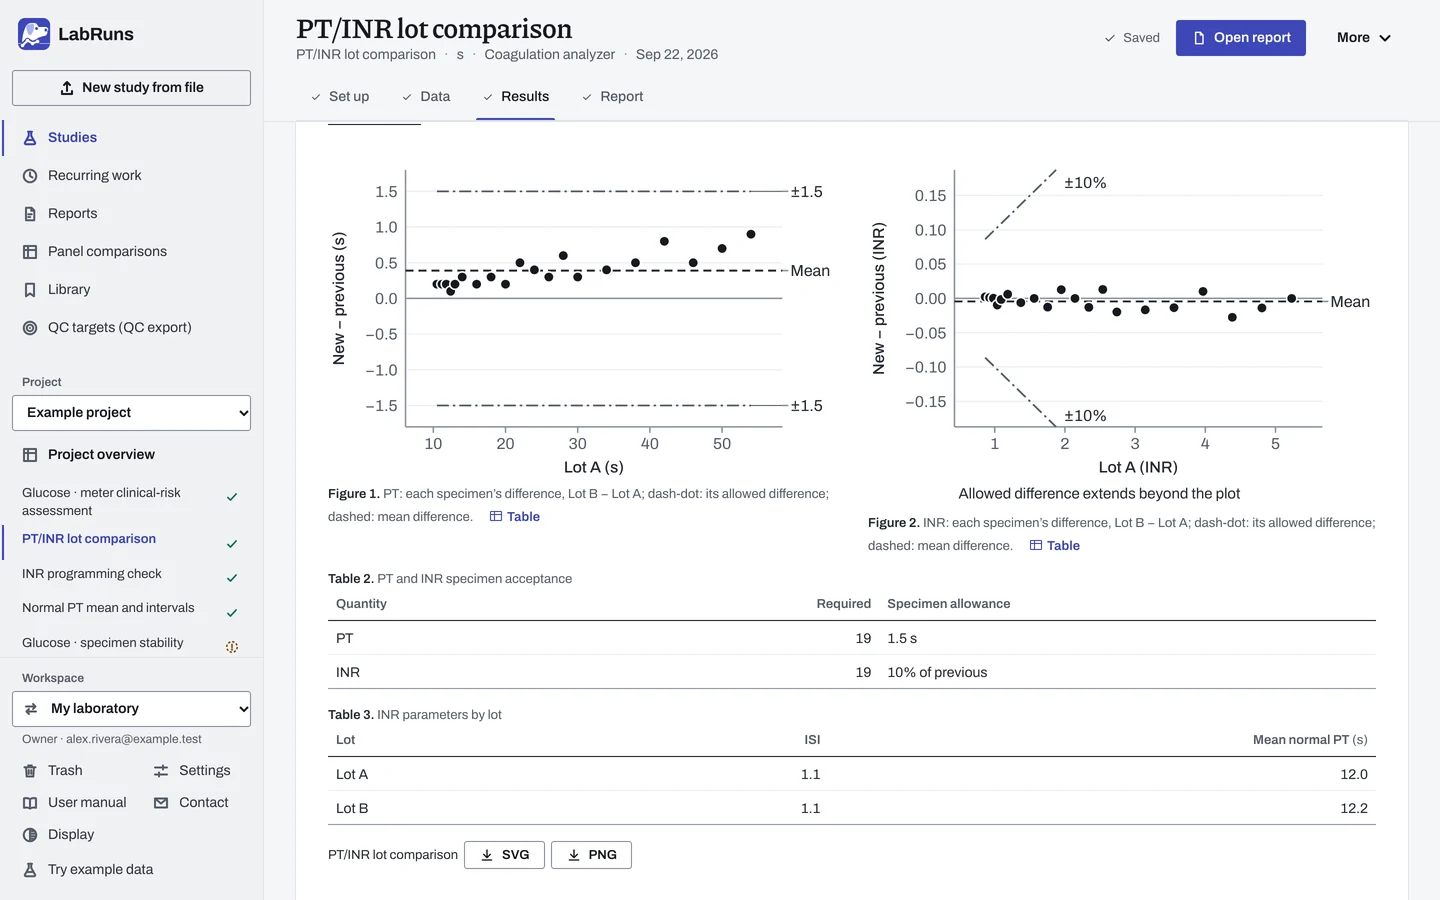
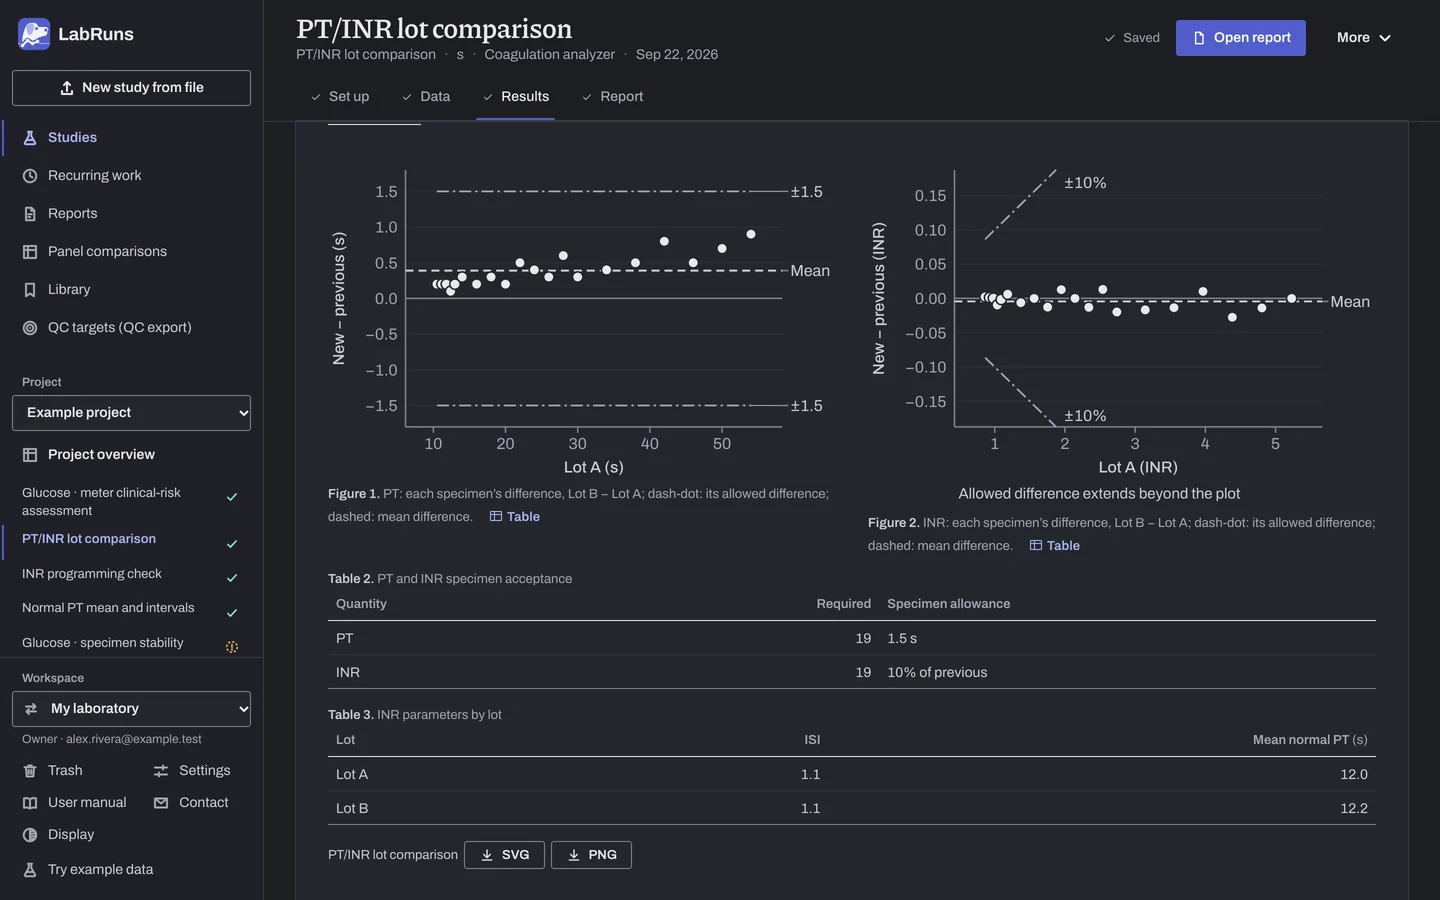
- Normal PT mean and intervals: the geometric mean PT and its confidence interval, calculated INRs, and counts below, within and above each proposed interval, with the specimen IDs below and above it. The mean ± 2 SD ranges are descriptive summaries.
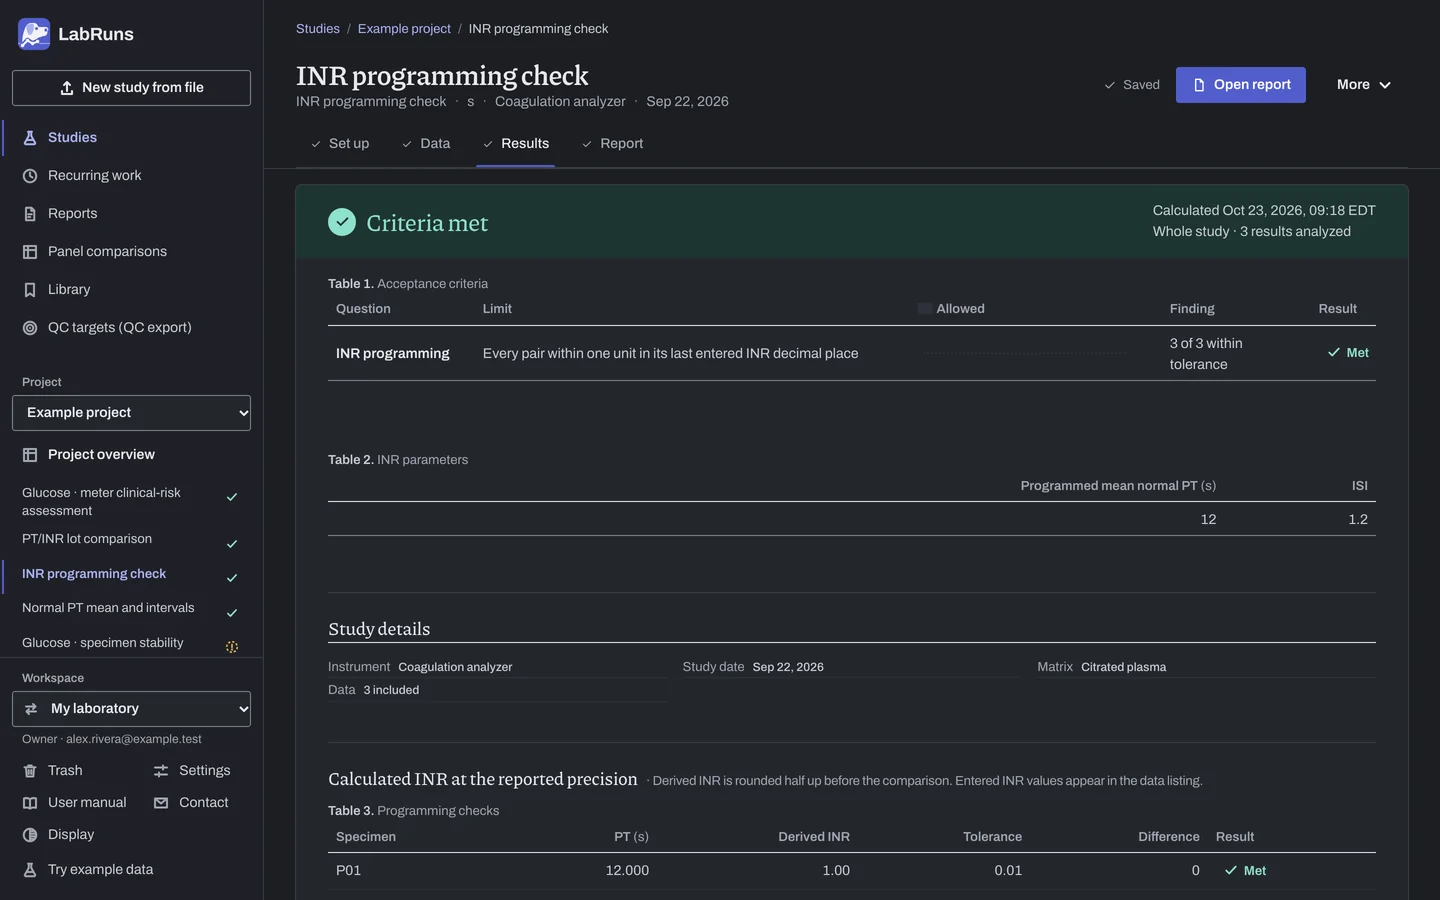
- INR programming check: for each row, the reported INR, the derived value rounded to the reported precision, its tolerance and the decision.
- PT/INR lot comparison: the separate PT and INR decisions and the lot-plan coverage, with the supporting regression statistics.
Example
Section titled “Example”The programming example uses mean normal PT 12 s and ISI 1.2. PT results of 12, 24 and 36 s give derived INRs rounded to two places of 1.00, 2.30 and 3.74. All three reported pairs meet the programming tolerance.
The normal example contains 20 independent normals across three days, each with its collection Day recorded in Data. With ISI 1.1, proposed PT interval 10–14 s and INR interval 0.8–1.2, the geometric mean PT is 12.00 s and all 20 specimens are within each interval.
Calculations and sources
Section titled “Calculations and sources”The equation and normal-mean design follow WHO Technical Report Series 979, Annex 6. Calculation evidence checks an independently derived geometric mean, interval endpoints, decimal reporting precision and the specimen-count rule. See Calculation checks.
Normal PT mean and intervals
Section titled “Normal PT mean and intervals”When you calculate Normal PT mean and intervals in the example project, LabRuns records these methods:
- INR = (PT / mean normal PT)^ISI. Each reagent lot uses its own ISI and mean normal PT. PT values and all INR calculations use decimal arithmetic with 50 digits of working precision.
- Mean normal PT is the geometric mean of positive PT results from at least 20 independent normal specimens. Replicates are averaged per specimen first. Its confidence interval is Student t on log PT, exponentiated.
- Proposed reference intervals include their endpoints. Each interval meets the laboratory’s count rule when no more than the selected number of independent normal specimens fall outside it. Mean ± 2 SD is a descriptive range; the reference interval remains the one the laboratory established.
INR programming check
Section titled “INR programming check”When you calculate INR programming check in the example project, LabRuns records the methods above and these:
- Programming checks round derived INR half up at the precision of the entered INR. A difference no greater than one last-place unit meets the application’s programming tolerance.
PT/INR lot comparison
Section titled “PT/INR lot comparison”When you calculate PT/INR lot comparison in the example project, LabRuns records the methods above and these:
- Lot comparison averages each specimen’s PT on each lot and derives INR from these mean PTs. PT and INR have separate specimen allowances; when both absolute and percentage allowances are entered, the larger applies. Equality is within allowance.
- At least 95% of specimens, rounded up to a whole specimen, must meet each lot allowance. This requires every one of fewer than 20. The Every specimen option requires 100%. At least two paired specimens and a complete lot plan are required.
- PT and INR regression and difference statistics use the comparison engine and the selected primary model. The stated Deming error-variance ratio is Var(new-lot error) / Var(previous-lot error); fitted statistics do not decide specimen acceptance.
- Residuals are the test result minus the result fitted by the primary regression line.
- The fitted-response confidence band is pointwise. OLS uses Student t(n−2) with the residual SD and leverage. Deming fits use Linnet’s jackknife t(n−2) intervals. Weighted Deming iteration uses a shared concentration scale and a convergence tolerance of 1e-10.
- Comparative results are x and test results are y. Replicate pairs are averaged to one mean pair per specimen.
- Ordinary least squares fits y on x. It assumes the comparative method has negligible error and the test errors have constant variance.
- Deming regression uses λ = Var(test error)/Var(comparative error) = 1.000, with constant error variance on both axes. λ is an assumed error-variance ratio. Weighted Deming assumes spread proportional to concentration and needs results above zero. Both use jackknife t(n−2) intervals.
- Passing-Bablok is the shifted median of pairwise slopes, with rank-based CIs. It assumes a positive linear relationship and similar error distributions on both axes.
- The 95% limits of agreement are mean bias ± 1.96 SD. Mean bias has a 95% Student t CI, and the limits have CIs from SE = √(3s²/n). The CI is for the mean bias. The limits of agreement are for individual differences.
- Slope, intercept and bias at each medical decision level come from the primary fit. Bias outside the studied range is inconclusive. Criteria evaluate the unrounded estimates.
- Pearson r, from the least-squares fit, describes linear association and grows with the studied range.
- A specimen allowance below 1.96 × the SD of a matched difference from imprecision alone (the pooled repeatability SD of the two methods, from replicate pairs or linked precision studies, times √(2/k) for k replicates per specimen) is cautioned with the share of specimens imprecision alone would put outside it. The caution changes no decision.
- Reportable-range coverage is the width of the overlap between the observed reference-axis range and the claimed reportable range, divided by the claimed range width, times 100. It describes the tested span; accuracy and verification of the reportable range are separate questions. Replicate results are averaged by specimen before determining the observed range.
Evidence references: CAP COM.40300, COM.40350, COM.30450 (9 December 2025). In a binder, the CAP evidence index lists the report sections behind each requirement and the laboratory records that go with them.