


Instrument comparison reference
An instrument comparison shows how far each instrument reads from the reference analyzer on the same specimens, and whether each specimen's difference is within its allowable difference. Every difference is instrument minus reference analyzer.
Settings
Section titled “Settings”| Setting | Meaning |
|---|---|
| Reference analyzer | Asked in New study, and shown under Reference analyzer on Set up. It keeps the one named, including while its results are missing or excluded. Left blank, it starts on the first instrument in the data |
| Instruments | The instrument list on Set up is filled from the file. Every save and calculation takes the instruments from the Instrument column |
| Claimed lower reportable limit, Claimed upper reportable limit | Under Reportable-range coverage (optional). With both, the saved result shows the percentage of that interval spanned by matched specimen means on the reference analyzer, for each paired analyzer comparison. It describes the tested span. Acceptance and reportable-range verification are separate |
Specimens and counts
Section titled “Specimens and counts”The study needs specimens measured on every instrument including the reference, one analyte in one exact unit, the same instrument names on every row, and one concentration level per specimen, for example 1, 2 or 3.
The experimental unit is the specimen. Replicates on one instrument are averaged. An instrument's mean difference uses the specimens with an included result on both it and the reference. For the specimen rule, a specimen missing either result counts as not evaluated. When a specimen's row on one instrument is excluded with a reason, for example a short sample, that specimen leaves that instrument's count only.
| Count | What happens |
|---|---|
| Fewer than 2 specimens with a reference result | No calculation. |
| Fewer than 5 specimens | The specimen limit is Undecided. |
| An instrument with fewer than 2 comparable specimens | No SD, limits of agreement or interval, and its mean-bias limit is Undecided. |
| A level with 1 comparable specimen | No SD for that level. |
Columns
Section titled “Columns”| Column use | Grid column | Required? | What to enter |
|---|---|---|---|
| Specimen or material ID | Specimen ID | Yes | Coded ID, the same on every instrument's row for that specimen |
| Instrument | Instrument | Yes | The instrument that produced this result, by its exact name, for example Analyzer A |
| Result | Result | Yes | A number in the study unit |
| Level or group | Level | No | One level per specimen, for example 1, 2 or 3. Rows start at 1 when the file has no level column |
| Replicate | Replicate | No | Replicate label |
Each row holds one result. Unit, Analyte and Matrix still group the file; see Files that mix analytes, matrices, instruments or units. The optional Excluded and Exclusion reason columns are in Fields every study type offers.
The calculation stops when a specimen has more than one concentration level, or when the reference analyzer has results for fewer than two specimens.
Acceptance limits
Section titled “Acceptance limits”The specimen rule, Individual specimen agreement, decides agreement. Each specimen is checked against the limit at its reference result. With 5–19 specimens, all must be within their limits. With 20 specimens 19 must be, and with 25 specimens 24. A percentage limit needs a reference result above zero on a ratio scale. A specimen that can't be evaluated leaves the limit Undecided unless enough specimens already fail. Each instrument other than the reference gets an outcome; the reference analyzer has none.
Applies to sets whether a limit covers All analyzers or one analyzer. Instrument bias vs reference analyzer (under More statistics) adds a check on the mean difference, in the study unit. Without a specimen rule, a built-in Specimen agreement check stays Undecided for each analyzer and the study can't reach Criteria met. See About acceptance decisions.
Results and plots
Section titled “Results and plots”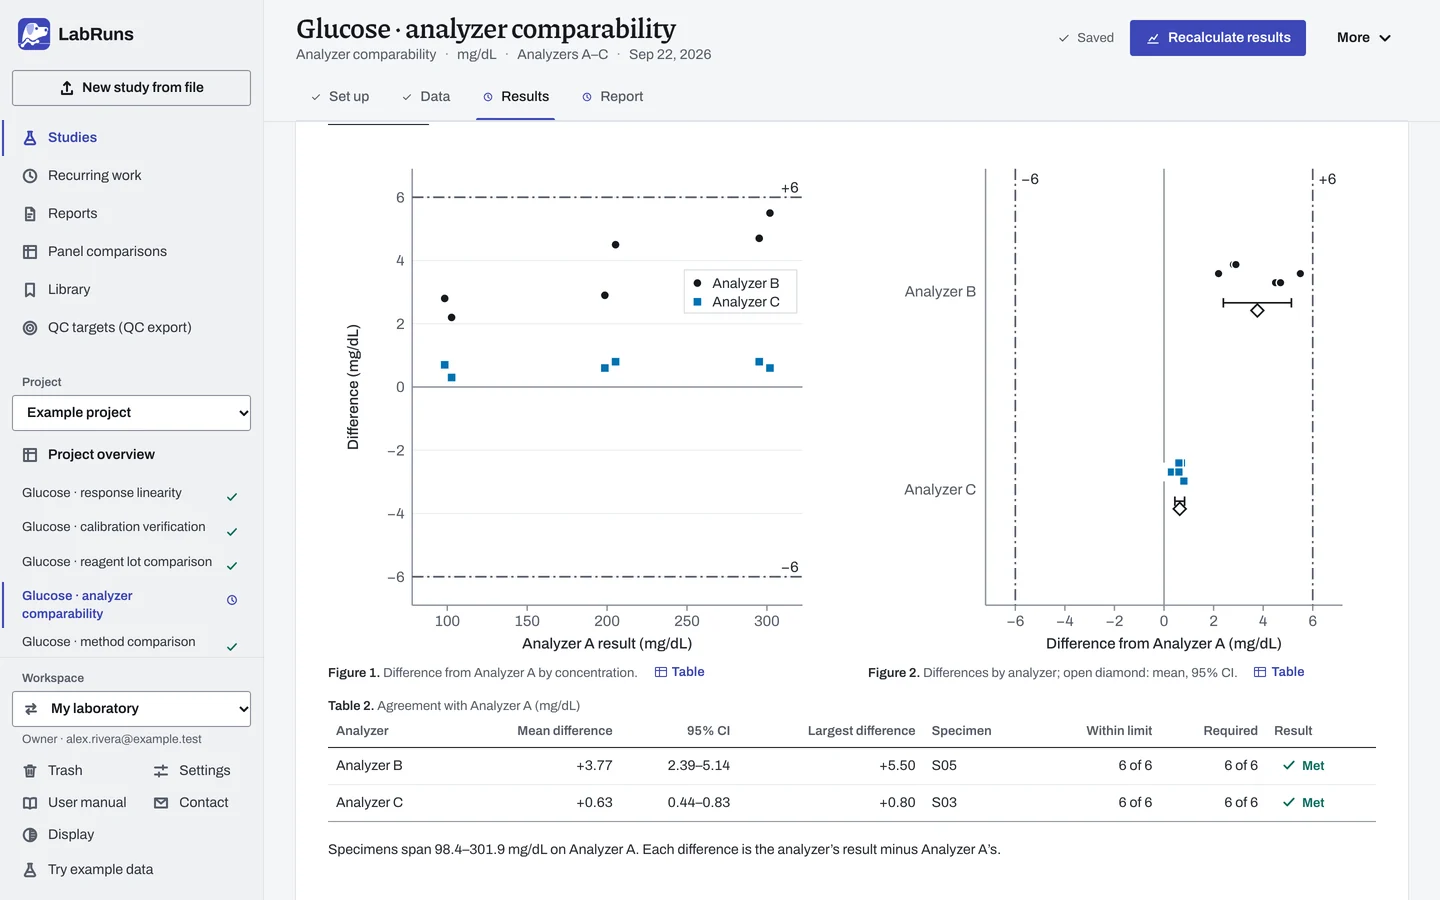
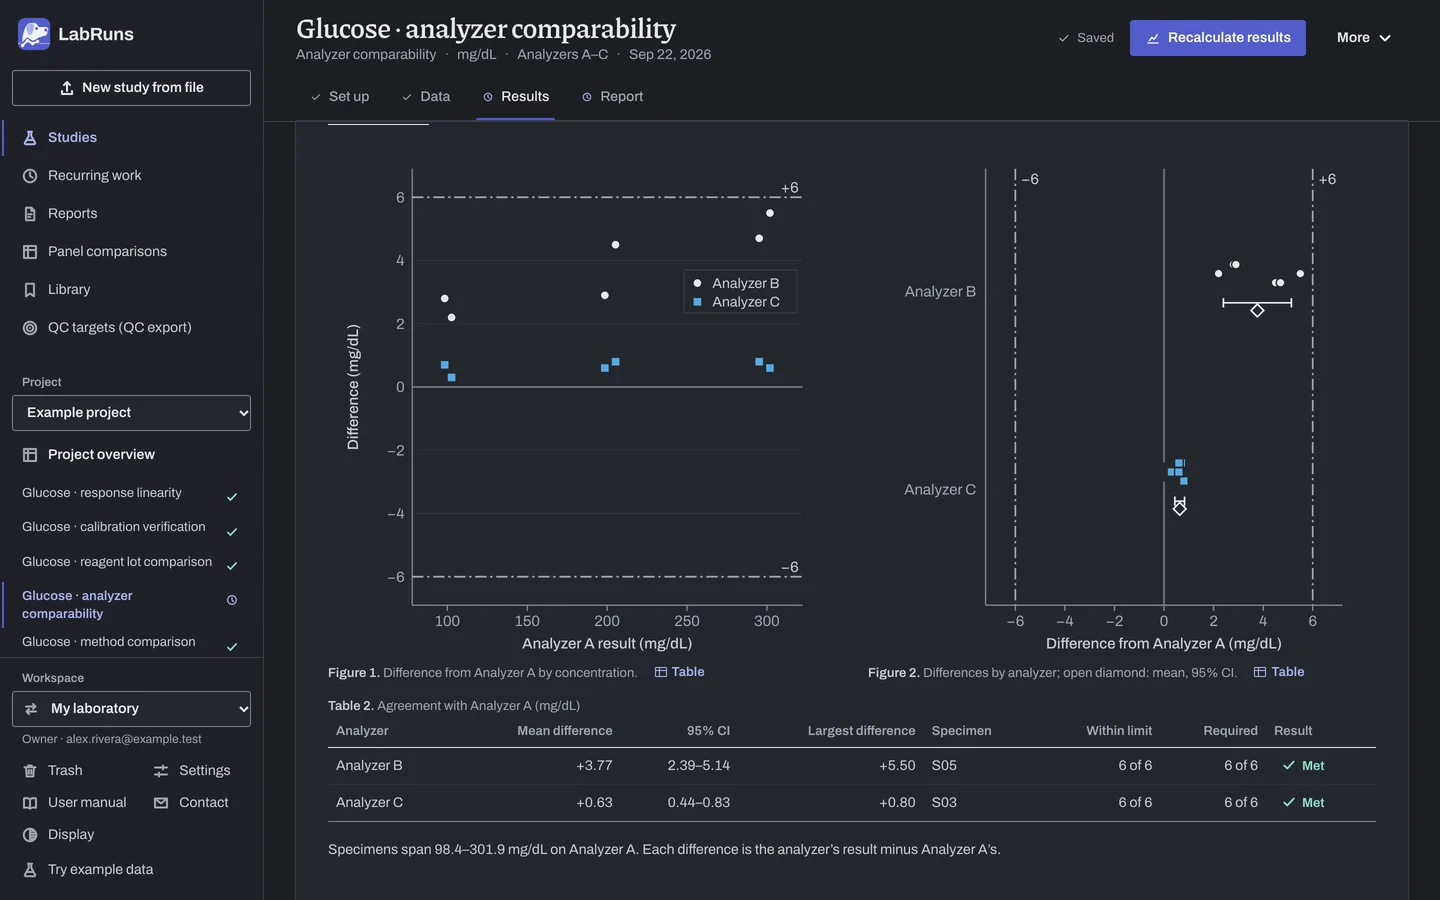
The top of the page gives the verdict. The acceptance table below it gives each analyzer's count within limits, for example 3/6 (50%), and its outcome (Met, Not met or Undecided).
Agreement with the reference analyzer, for example Agreement with Analyzer A, gives one row per analyzer: mean difference, its CI, the largest difference and its specimen, the specimens within limit and required, and Result. A note on an undecided analyzer says why.
Detailed statistics → Differences vs the reference analyzer · … gives, for the analyzer chosen under Instrument details:
- 95% CI for the mean difference: how well the average bias is known.
- 95% limits of agreement: where about 95% of this instrument's specimen differences fall.
- Per-level bias: whether bias changes with concentration.
- Specimen differences: each specimen's mean, difference and replicate count, shown when there is no specimen rule.
Under Results, Differences by specimen gives each specimen's reference result and each analyzer's difference and outcome. Concentration-dependent allowances appear beside the differences. Differences by analyzer and level gives the spread of the differences and the mean difference at each concentration level.
Page 1 of the report holds the decision. Two plots show every specimen's difference from the reference analyzer: against the reference result, and by analyzer with each analyzer's mean difference and CI. The allowable difference is drawn as dashed lines. One row per analyzer gives its mean difference, CI, largest difference, specimens within limits, specimens required and result. The acceptance criteria follow. The data listing on page 2 gives every result as entered. After it, Differences by specimen gives each specimen's difference and outcome on every analyzer, and each specimen's allowed difference when it changes with concentration. The spread of the differences (SD and limits of agreement) and the mean difference at each concentration level follow it.
Example
Section titled “Example”comparability.csv holds six example glucose specimens, S01 to S06, in three levels, each measured once on Analyzers A, B and C. That is 18 rows.
specimen_id,instrument,result,level,replicate
S01,Analyzer A,98.4,1,1
S01,Analyzer B,101.2,1,1
S01,Analyzer C,99.1,1,1
| Setting | Value |
|---|---|
| Analyte, unit | Glucose, mg/dL |
| Reference analyzer | Analyzer A |
| Instruments (from the data) | Analyzer A, Analyzer B, Analyzer C |
| Confidence level | 95% |
| Acceptance limit | "Specimen differences": Specimen difference, ±4 mg/dL, All analyzers |
| Analyzer | Mean difference | 95% CI | Largest difference | Specimen | Within limit | Required | Result |
|---|---|---|---|---|---|---|---|
| Analyzer B | +3.77 | 2.39–5.14 | +5.50 | S05 | 3 of 6 | 6 of 6 | Not met |
| Analyzer C | +0.63 | 0.44–0.83 | +0.80 | S03 | 6 of 6 | 6 of 6 | Met |
| Analyzer | Observed | Outcome |
|---|---|---|
| Analyzer B | 3/6 (50.00%) | Not met |
| Analyzer C | 6/6 (100.00%) | Met |
| Estimate | Analyzer B | Analyzer C |
|---|---|---|
| 95% CI for the mean difference | 2.39–5.14 | 0.44–0.83 |
| SD of differences | 1.31 | 0.186 |
| 95% limits of agreement | 1.20–6.33 | 0.27–1.00 |
| 95% CIs for the limits | −1.17 to 3.58; 3.95–8.71 | −0.07 to 0.61; 0.66–1.34 |
| Level | Mean difference (mg/dL) | SD (mg/dL) |
|---|---|---|
| 1 | +2.50 | 0.424 |
| 2 | +3.70 | 1.13 |
| 3 | +5.10 | 0.566 |
C agrees with A. B reads higher, and its bias grows with concentration. B's mean difference of +3.77 mg/dL is within ±4 mg/dL, but three specimens are outside the limit: S03 +4.50, S05 +5.50 and S06 +4.70. B is Not met, so the study status is Criteria not met. The example project's Glucose · analyzer comparability uses a ±6 mg/dL limit, so every specimen on B and C is within it and that study reads Criteria met.
A missing result. Excluding S06 on Analyzer C with the reason Short sample leaves C with 5 compared specimens and a mean difference of +0.60 mg/dL. S06 leaves C's count, so C's limit shows 5/5 (100.00%) and Met. If C's S06 result is absent, with no excluded row, S06 counts as not evaluated, so C's limit shows 5/6 (83.33%) and Undecided. Either way the study status is still Criteria not met because B is Not met.
Calculations and sources
Section titled “Calculations and sources”When you calculate Glucose · analyzer comparability in the example project, LabRuns records these methods:
- Replicate results are averaged to one mean per specimen and instrument. n counts specimens.
- Differences are each instrument's specimen mean minus the reference analyzer (Analyzer A) mean for the same specimen, using only specimens measured on both.
- Mean bias has a Student t CI. The 95% limits of agreement are mean ± 1.96 SD, with CIs from SE = √(3s²/n). Per-level bias is the mean and SD of the differences at each concentration level.
- Missing results are counted and left out of the differences. A specimen without a result on an analyzer stays in that analyzer’s specimen rule and keeps it from passing, unless that analyzer’s rows for the specimen are excluded with a reason, which leaves the specimen out of that analyzer’s count. Criteria evaluate the unrounded estimates.
- Reportable-range coverage is the width of the overlap between the observed reference-axis range and the claimed reportable range, divided by the claimed range width, times 100. It describes the tested span; accuracy and verification of the reportable range are separate questions. Replicate results are averaged by specimen before determining the observed range.
- Specimen agreement: the allowance at reference result X is A, or P × X / 100, or with both limits the larger, max(A, P × X / 100) (Pass when within either (the larger allowance)) or the smaller, min(A, P × X / 100) (Pass only when within both), as chosen under With both limits. The specimen is within its limit when |d| ≤ allowance, inclusive. The comparison uses exact decimal arithmetic on unrounded values.
- Summary: the mean-difference CI and the CIs of the limits of agreement use t(n − 1) (Giavarina 2015).
- Reportable-range coverage runs from 0% to 100%. For example, comparator results from 40 to 240 mg/dL cover 71.4% of a claimed 20–300 mg/dL interval.
Sources: NIST/SEMATECH e-Handbook; Giavarina 2015. See Study reference.
Evidence references: CAP COM.04250, COM.04300 (9 December 2025). In a binder, the CAP evidence index lists the report sections behind each requirement and the laboratory records that go with them.