


Dilution verification reference
For each dilution, the reading × the dilution factor gives the corrected result, and the corrected result ÷ the expected neat concentration gives the recovery. Each reading is also checked against the reportable range, and each level reports the range of corrected results it verified.
Settings
Section titled “Settings”Each high specimen or pool is a level with its own expected neat concentration.
| Setting | Where | What it does |
|---|---|---|
| Lowest reportable value before dilution, Highest reportable value before dilution | New study | The reportable range limits on Set up |
| Expected value of the undiluted sample | New study | Becomes the expected value for level 1 |
| Assigned values | Set up | One row per level with its expected neat concentration. Each level in the data gets its own row automatically |
| Lower reportable range limit, Upper reportable range limit | Set up, Reportable range | The validated limits for readings before correction |
| Claimed lower limit, Claimed upper limit | Set up, Reportable range | Optional: both or neither |
| Dilution recovery | Acceptance limits, Enter your own limit | Lowest acceptable recovery (%) and Highest acceptable recovery (%). One left empty gives a one-sided limit. Applies to limits it to one level |
| Measurement scale | Calculation settings | Recovery needs a ratio scale |
Columns
Section titled “Columns”One row per dilution.
| Column use | Grid column | Required | What to enter |
|---|---|---|---|
| Specimen or material ID | Specimen ID | A specimen ID or a level | The pool or specimen ID, for example HP-1. A blank specimen ID uses the level |
| Result | Measured result | Yes | The reading of the diluted aliquot, before correction |
| Specimen volume, Diluent volume | Specimen volume, Diluent volume | See below | Both volumes in the same unit, for example 100 and 400 |
| Dilution factor | Stated factor | See below | The overall factor as a decimal, for example 5. 1 means undiluted |
| Serial dilution steps | Serial steps | See below | Each step's factor, for example 5, 2. Steps are separated with commas, or with semicolons under a decimal comma. The overall factor is their product |
| Diluent | Diluent | No | For example Saline |
| Level or group | Level | A specimen ID or a level | Must match a level in Assigned values. A blank level uses the specimen ID, so rows from a file without a Level column are grouped by specimen ID. New rows added on Data start in level 1 |
| Replicate | not shown | No | Replicate label |
Each row gives its factor one of three ways. If a row has more than one, they must agree.
- Volumes: (specimen + diluent) / specimen. 100 + 400 gives 5. 50 + 950 gives 20.
- Stated factor: used as written.
- Serial steps: multiplied.
5, 2gives 10.
Ratio notation such as 1:5 is ambiguous: it can mean factor 5 or factor 6. A stated factor follows the study's number format: 1,000 is 1000 with a decimal point and 1 with a decimal comma. See Numbers, units and identifiers.
The calculation stops, with a message on the row or on Set up, when:
- a row has no volumes, stated factor or serial steps, only one of the two volumes, a factor below 1, two ways of giving the factor that disagree, or neither a specimen ID nor a level
- the reportable range is missing, or its lower limit is at or above the upper
- only one claimed limit is entered
- a level has no assigned value
Acceptance limits
Section titled “Acceptance limits”- Each dilution gets its own outcome. One dilution that is Not met makes the study Criteria not met.
- A dilution read outside the reportable range is Undecided. Its recovery is still shown, and it is left out of the verified range.
- A level with fewer than 2 recoveries is Undecided.
- A limit for one level is Not applicable to the others.
- On an interval scale (Measurement scale under Calculation settings), recovery limits are Undecided and no range is verified.
Results and plots
Section titled “Results and plots”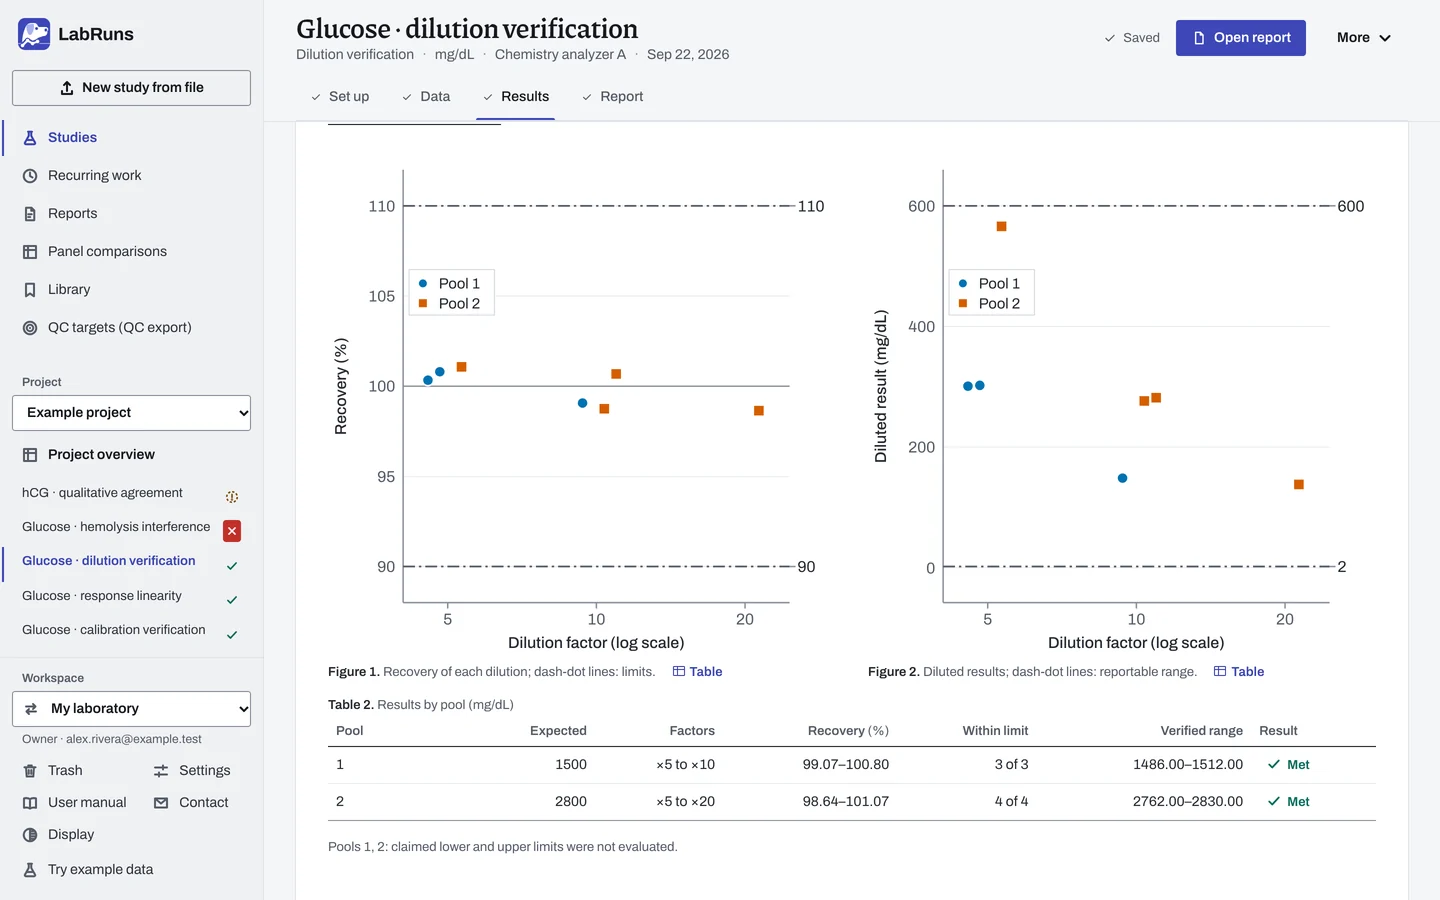
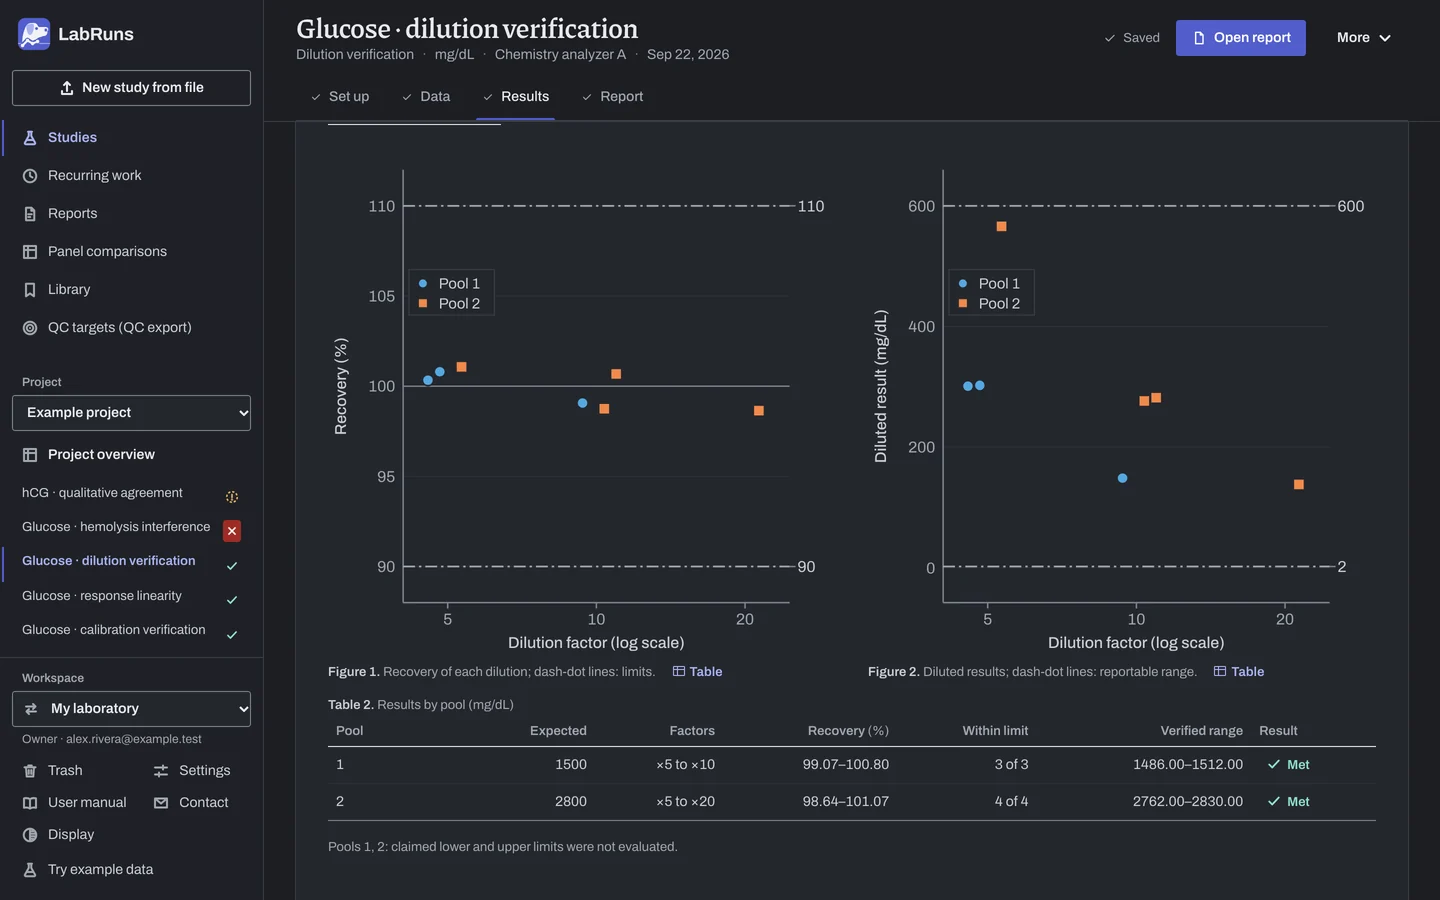
With more than one pool, Concentration level details switches between them. The two plots show each dilution's recovery against the limits and each measured reading against the reportable range, both as dashed lines. Below them:
- Results by pool: expected neat concentration, factors tested, recoveries, how many dilutions are within the limit, the verified range and the pool's result.
- Acceptance criteria: the recovery limit and which dilutions, if any, fell outside it.
- Dilutions: specimen and row number, preparation (volumes, serial steps or Stated), factor, measured value, In range (Yes or No), corrected value, recovery and each dilution's result.
- Corrected results evaluated, when a dilution read inside the reportable range but failed its recovery limit.
A claimed limit beyond the verified range is named in a note on the results.
Recovery that falls at higher dilutions points to a matrix or diluent effect, even when every value passes.
Example
Section titled “Example”The example project's study Glucose · dilution verification uses dilution.csv: pools HP-1 (level 1, three dilutions) and HP-2 (level 2, four dilutions), with factors from volumes, a stated factor and serial steps 5, 2.
Setup: analyte Glucose, unit mg/dL. Reportable range 2 to 600 mg/dL. Claimed range 2 to 3000 mg/dL. Expected neat 1500 mg/dL (level 1) and 2800 mg/dL (level 2). Limit: Dilution recovery, 90 to 110 %.
| Pool | Specimen | Row | Preparation | Factor | Measured | In range | Corrected | Recovery (%) | Result |
|---|---|---|---|---|---|---|---|---|---|
| 1 | HP-1 | 1 | 100 + 400 | ×5 | 301.0 | Yes | 1505.00 | 100.33 | Met |
| 1 | HP-1 | 2 | 100 + 900 | ×10 | 148.6 | Yes | 1486.00 | 99.07 | Met |
| 1 | HP-1 | 3 | Stated | ×5 | 302.4 | Yes | 1512.00 | 100.80 | Met |
| 2 | HP-2 | 4 | 100 + 400 | ×5 | 566.0 | Yes | 2830.00 | 101.07 | Met |
| 2 | HP-2 | 5 | 100 + 900 | ×10 | 276.5 | Yes | 2765.00 | 98.75 | Met |
| 2 | HP-2 | 6 | 5 × 2 | ×10 | 281.9 | Yes | 2819.00 | 100.68 | Met |
| 2 | HP-2 | 7 | 50 + 950 | ×20 | 138.1 | Yes | 2762.00 | 98.64 | Met |
| Pool | Expected | Factors | Recovery (%) | Within limit | Verified range | Result |
|---|---|---|---|---|---|---|
| 1 | 1500 | ×5 to ×10 | 99.07–100.80 | 3 of 3 | 1486.00–1512.00 | Met |
| 2 | 2800 | ×5 to ×20 | 98.64–101.07 | 4 of 4 | 2762.00–2830.00 | Met |
The study status is Criteria met: all seven dilutions meet the limit. Each level carries a warning that the claimed lower and upper limits were not evaluated. For level 1, the lowest usable corrected result is 1486.00 mg/dL, far above the claimed 2 mg/dL.
If one dilution reads 750 mg/dL, above the 600 mg/dL limit, its recovery is still shown but its outcome is Undecided, and it is left out of the verified range. A level with only one usable dilution gets no verified range.
Calculations and sources
Section titled “Calculations and sources”When you calculate Glucose · dilution verification in the example project, LabRuns records these methods:
- The dilution factor comes from volumes, a stated factor or serial steps. If you give more than one, they must agree.
- Factor from volumes = (specimen + diluent) / specimen. Serial steps are multiplied.
- Corrected result = measured value × factor. Recovery = 100 × corrected result / expected undiluted concentration.
- A dilution measured outside the reportable range cannot pass.
- The verified range spans the corrected results of at least 2 dilutions measured inside the reportable range that meet every recovery criterion.
- Claimed limits outside the verified range are flagged.
- Recovery % needs a positive expected value and a ratio scale. Each recovery is a point estimate.
- Verified range: the reportable range includes its limits. Without a recovery limit there is no verified range.
- Evaluated range = all corrected values with readings inside the reportable range, failed recoveries included. When it differs from the verified range, the report lists it under Corrected results evaluated.
See Study reference.
Evidence references: CAP CHM.13710, CHM.13720 (9 December 2025). In a binder, the CAP evidence index lists the report sections behind each requirement and the laboratory records that go with them.